
- USD/CHF gains traction after failing to break new yearly lows.
- USD/CHF Price Analysis: Bearish Bias; could test 0.9059 and below.
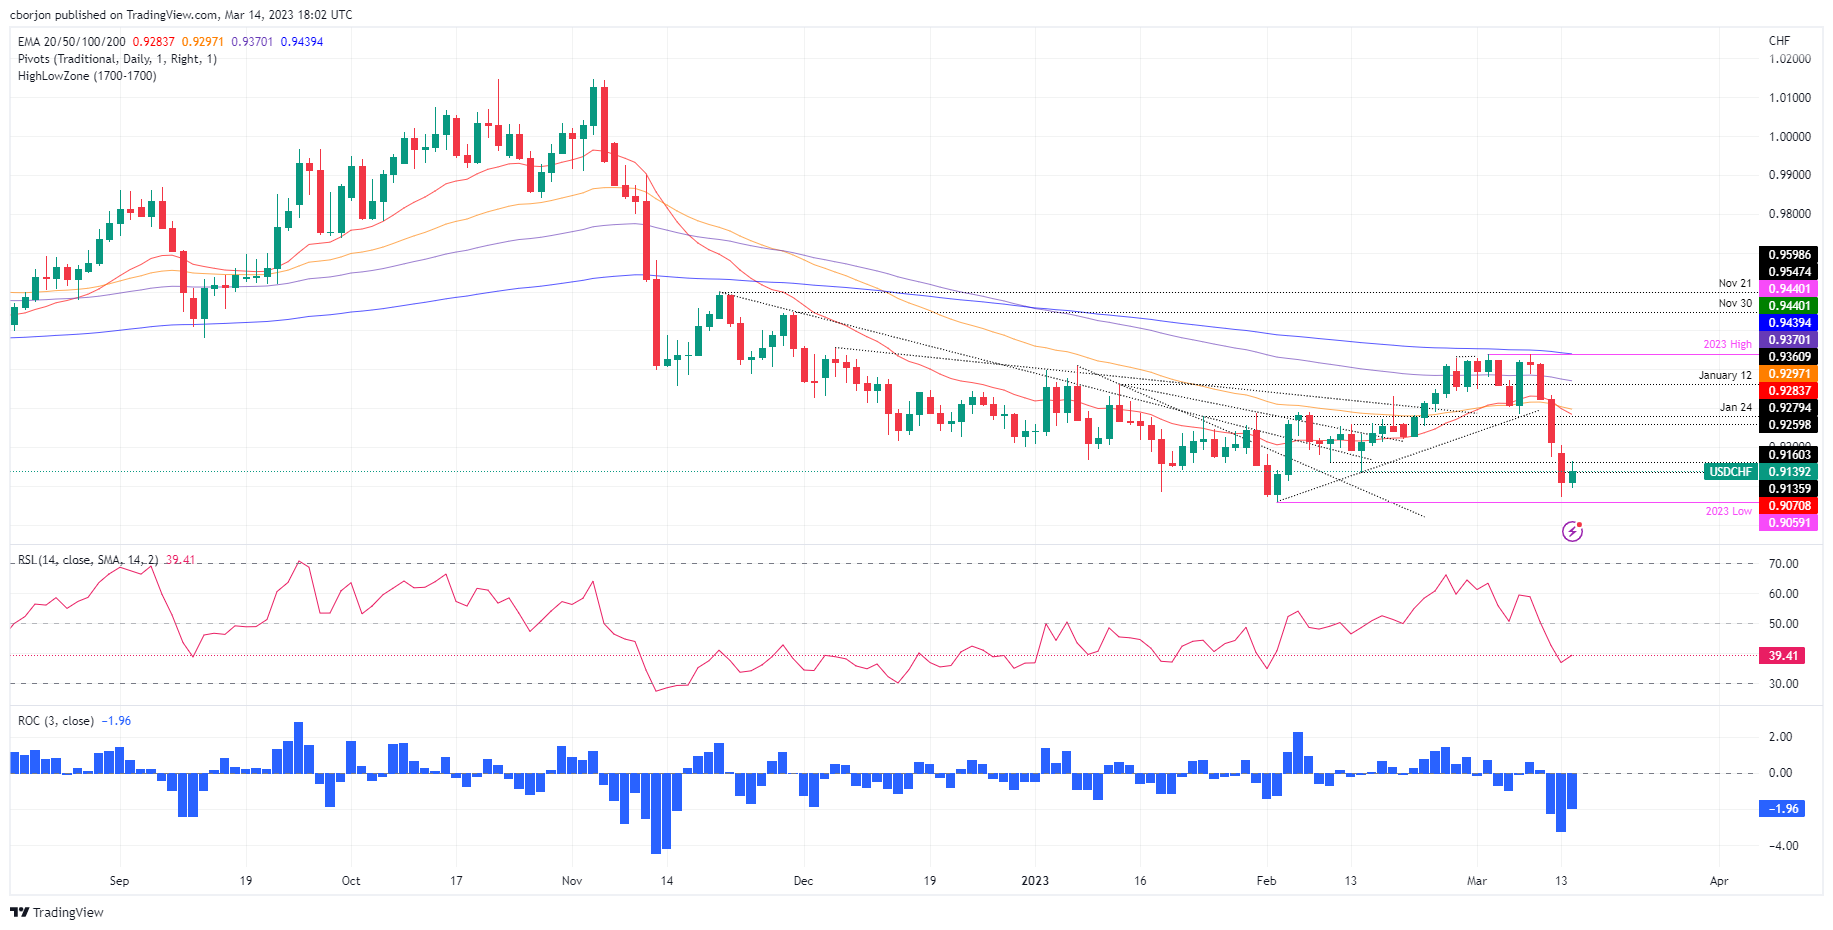
USD/CHF pared some of its Monday losses and moved positively on Tuesday, gaining 0.47%. USD/CHF is trading at 0.9151 after hitting a daily low of 0.9094 early in the European session.
USD/CHF Price evolution
After tumbling for three consecutive days, the USD/CHF pair bottomed out at 0.9070, far from its year-to-date lows. However, the USD/CHF rally has not been enough to overcome the resistance of lows around 0.9160. This could exacerbate the downtrend, and USD/CHF could test the yearly lows soon.
The Relative Strength Index (RSI) remains in bearish territory, although it has turned flat. This means that the sellers are taking a breather before pushing prices lower. The Rate of Change (Rate of Change) shows buyers stepping in, but with insufficient force to change the trend. The path of least resistance is biased to the downside.
The first support for USD/CHF would be the 0.9100 zone. If broken below, the pair could fall towards the March 13 daily low at 0.9070 before testing the yearly low at 0.9059, ahead of the 0.9000 figure. In an alternate scenario, USD/CHF’s first resistance would be the March 13 daily high at 0.9205. Once broken, the next USD/CHF resistance would be the 20-day EMA at 0.9283 before reaching 0.9300.
USD/CHF Daily Chart
USD/CHF Technical Levels
Source: Fx Street
I am Joshua Winder, a senior-level journalist and editor at World Stock Market. I specialize in covering news related to the stock market and economic trends. With more than 8 years of experience in this field, I have become an expert in financial reporting.


