
- USD/CHF trims part of its weekly losses, from 1.37% to 0.70%.
- US stocks fluctuate, reflecting mixed investor sentiment, courtesy of Google’s hiring halt.
- USD/CHF Price Analysis: A break above 0.9800 would open the door towards 0.9900.
The USD/CHF bounces off weekly lows around 0.9650, paring some of its weekly losses, and rises towards the 50-day moving average (DMA) around 0.9726, courtesy of fragile market sentiment, oscillating between risk aversion/appetite, during the American session. At the time of writing, USD/CHF is trading at 0.9722, up 0.49%.
USD/CHF Price Analysis: Technical Outlook
During the Asian session, USD/CHF started trading around 0.9678, close to daily lows. Later, the currency rose steadily, breaking the daily pivot point resistance level at 0.9710 and the 50-hour SMA at 0.9715, on its way to the daily high at 0.9736.
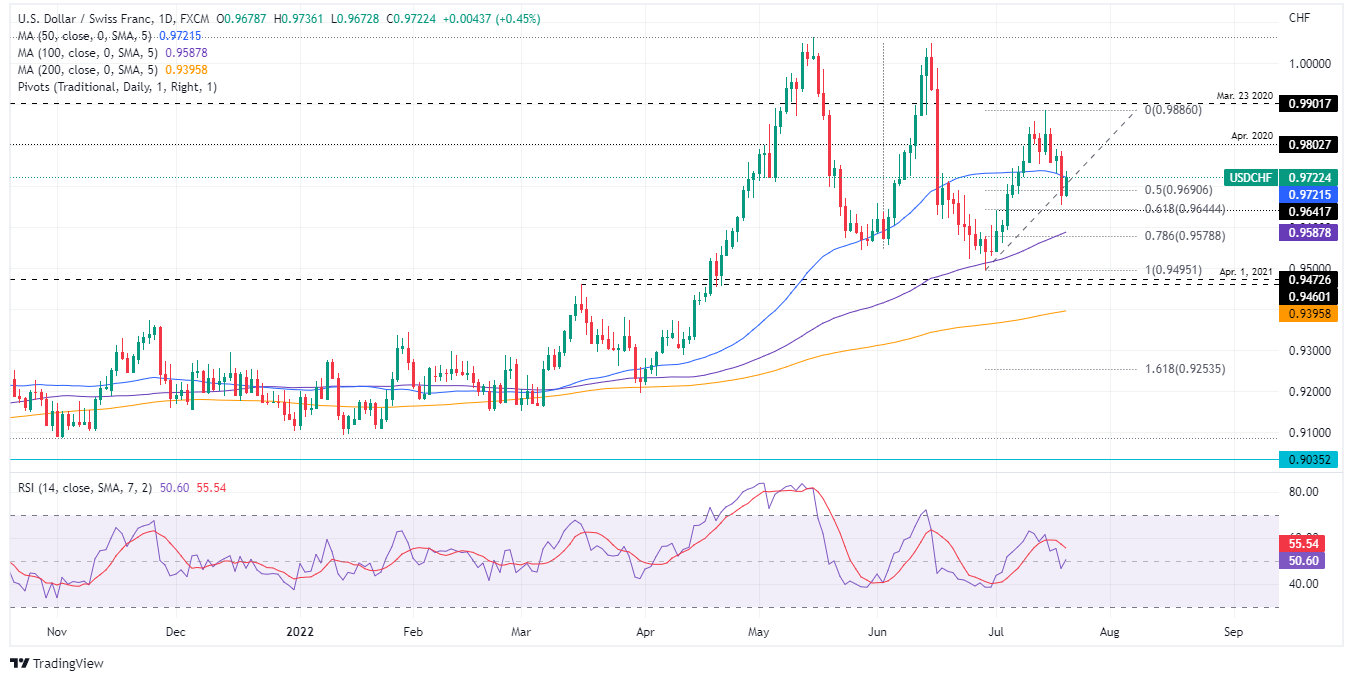
USD/CHF daily chart
USD/CHF has a bullish bias, despite trading below the 50-day moving average (DMA) at 0.6721. On Tuesday, the USD/CHF pair found bids just above the 61.8% Fibonacci retracement as the major retraced almost 100 pips on a daily basis, hitting a daily low of 0.9654, nine pips above the Fibonacci level. . As buyers stepped in, the pair broke above the 50% Fibonacci retracement and is facing solid resistance around the daily low of Jul 18 at 0.9730.
Therefore, the first resistance of the USD/CHF would be 0.9730. If it exceeds it, the daily high of July 19 at 0.9786 will be exposed, followed by 0.9800. Once this resistance is broken, the 14th July high at 0.9886 could be retested.
Key USD/CHF Technical Levels
Source: Fx Street
With 6 years of experience, I bring to the table captivating and informative writing in the world news category. My expertise covers a range of industries, including tourism, technology, forex and stocks. From brief social media posts to in-depth articles, I am dedicated to creating compelling content for various platforms.


