
- USD/CHF buyers reclaim the 0.9600 area and lift the pair to a daily high of 0.9651.
- US dollar strength amid rising risk appetite, tailwind for USD/CHF.
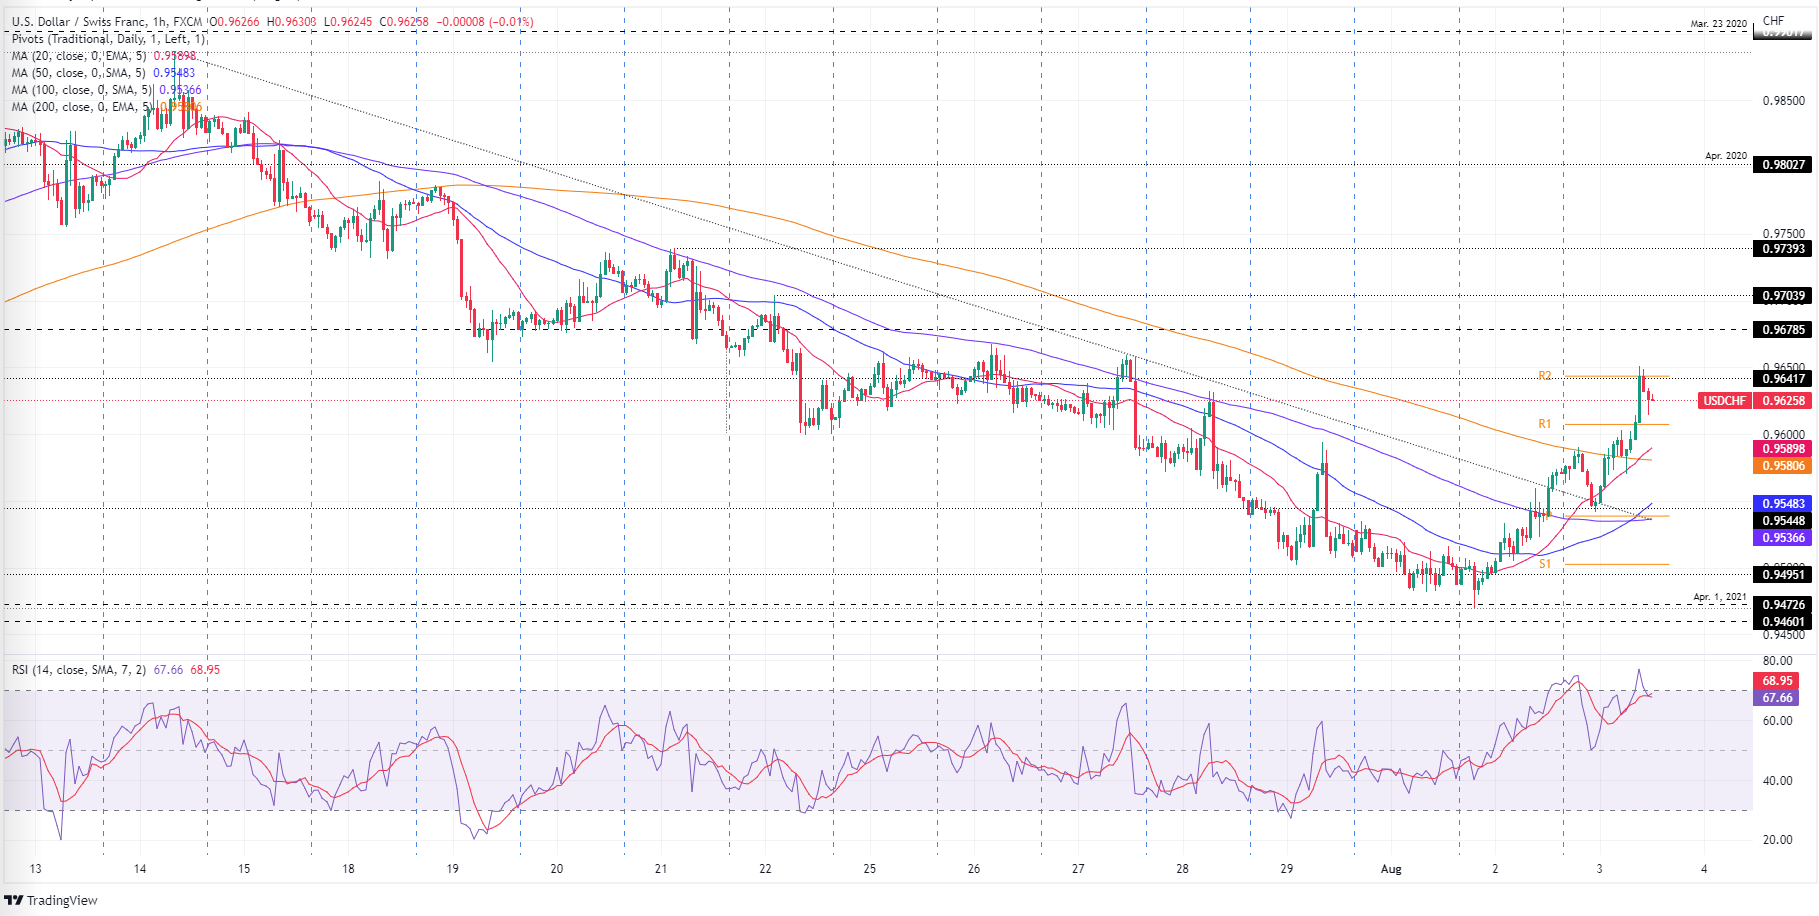
- The break of the trend line on the hourly chart exacerbates the USD/CHF rally above 0.9600.
The USD/CHF rises above the 100-day EMA and extends its gains to two straight days, up more than half a percent, on the boost from risk appetite as US bond yields rise, supported by comments from the Fed. The USD is also trading positive, as shown by the dollar index, which is up 0.18% to 106.546. At the time of writing, the USD/CHF is trading at 0.9625.
USD/CHF Price Analysis: Technical Outlook
In yesterday’s article, we noted that “USD/CHF rose, forming a bullish engulfing chart pattern, a reversal pattern indicating that buyers are outperforming sellers, keeping risks skewed to the upside.” On Wednesday, USD/CHF advanced strongly, breaking the 100-day EMA at 0.9626, as the major currency extended its gains towards the daily high at 0.9651. Although USD/CHF is pulling back, the major still has a neutral to bullish bias. That being said, USD/CHF traders should watch for a move towards the confluence of the 50 and 20 day EMAs around 0.9674-77.
USD/CHF 1 hour chart
USD/CHF has a bullish bias once the major broke solid resistance at a 15-day downtrend line around 0.9559, capping Tuesday’s rally towards 0.9600. Furthermore, the pair recaptured the 200 hourly EMA at 0.9580, which exacerbated a break above the 0.9600 area. That said, the first resistance for USD/CHF would be the R2 daily pivot at 0.9644, far from Wednesday’s daily high at 0.9651. Once broken, the next USD/CHF resistance levels will be the 22 Jul daily high at 0.9704 and the 21 Jul daily high at 0.9739.
Technical levels
Source: Fx Street
With 6 years of experience, I bring to the table captivating and informative writing in the world news category. My expertise covers a range of industries, including tourism, technology, forex and stocks. From brief social media posts to in-depth articles, I am dedicated to creating compelling content for various platforms.


