
- USD/CHF still has a bullish bias, but in the short term it could head towards 0.9600.
- A change in market sentiment, lower dollar demand, and a USD/CHF headwind.
- USD/CHF Price Analysis: Bearish-neutral, and if sellers retake 0.9670, the major will drop towards 0.9600.
The USD/CHF retreats for the second day in a row below 0.9700, amid an improving market mood weighing on the USD after the ECB made its first rate hike in 11 years, which initially sent USD/CHF down. towards its daily low at 0.9667. However, buyers stepped in and saw this as an opportunity for a better entry price. At the time of writing, the USD/CHF is trading at 0.9694.
Lately, sentiment has turned to the upside, as evidenced by the rise in US equities. However, it remains fragile, with high global inflation, a global economic slowdown and a looming US recession. Efforts by global central banks to tighten monetary conditions are likely to end a global recession.
USD/CHF Price Analysis: Technical Outlook
On Thursday, USD/CHF started trading around 0.9700, but rose as the environment turned sour, reaching a daily high of 0.9739. However, it trimmed earlier gains from the ECB decision, which took the pair to a daily low around 0.9667 before marching steadily away from 0.97000. However, the USD/CHF daily chart has a bullish bias, and unless the sellers retake 0.9495, the buyers remain in command.
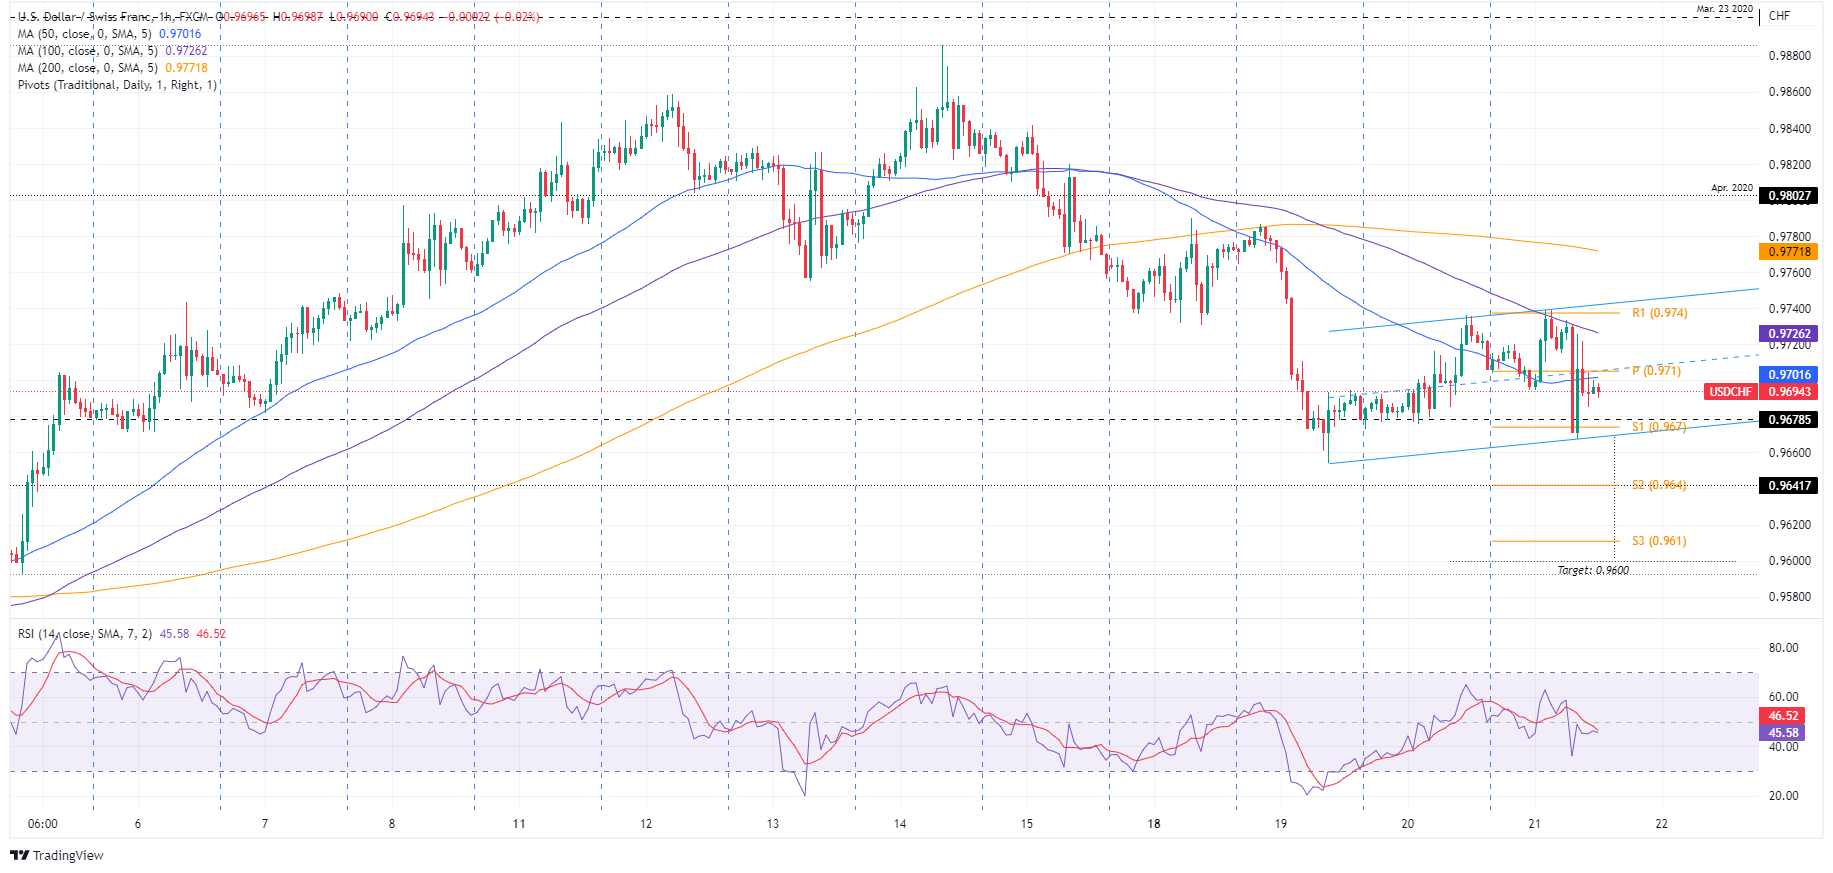
USD/CHF 1 hour chart
The USD/CHF hourly chart shows a bearish and neutral trend, with the SMAs above the exchange rate. Furthermore, the Relative Strength Index (RSI), although flat, is in the negative territory and below the 7-day SMA of the RSI, further consolidating the bias. That said, coupled with USD/CHF price action below the midline of an ascending channel, they suggest that the downtrend will continue in the near term.
Therefore, the first USD/CHF support would be the S1 daily pivot at 0.9675. A breakout of the latter will immediately expose the lower trend line of the mentioned ascending channel, which means that the next target for USD/CHF would be 0.9600. However, first USD/CHF sellers would have to break above the S2 pivot point at 0.9641 before reaching 0.9600
Key USD/CHF Technical Levels
Source: Fx Street
With 6 years of experience, I bring to the table captivating and informative writing in the world news category. My expertise covers a range of industries, including tourism, technology, forex and stocks. From brief social media posts to in-depth articles, I am dedicated to creating compelling content for various platforms.


