
- USD/CHF faces pressure above 0.9100 as the US Dollar falls following weak April S&P Global PMI data.
- The preliminary manufacturing PMI falls below the 50.0 threshold.
- The Fed advocates keeping interest rates at their current levels for longer.
The USD/CHF pair faces a sell-off above the 0.9100 round level support in the American session on Tuesday. The pair falls as the US Dollar Index (DXY) falls to 105.80 after S&P Global released weak preliminary PMI data for April.
The agency reported that both the manufacturing and services PMIs disappointed expectations. The manufacturing PMI falls below the 50.0 threshold that separates expansion from contraction. The factory reading stands at 49.9, below expectations of 52.0 and the previous reading of 51.9. The services PMI fell to 50.9, compared to the consensus of 52.0 and the previous reading of 51.7.
Looking ahead, investors will focus on US personal consumption expenditure (PCE) price index data for March, due out on Friday.
The price index PCE core is the preferred inflation measure of the Federal Reserve (Fed). It is estimated that it has grown by 0.3% month-on-month, and that annual inflation has softened to 2.6% from the 2.8% recorded in February. This will influence market expectations for the Fed's rate cuts, which are currently scheduled for the September meeting.
The 10-year US Treasury yield continues to rise to 4.64% as the Fed continues to maintain that the current monetary policy framework is adequate given that the stubborn rise in inflation in the first quarter of this year cannot be ignored.
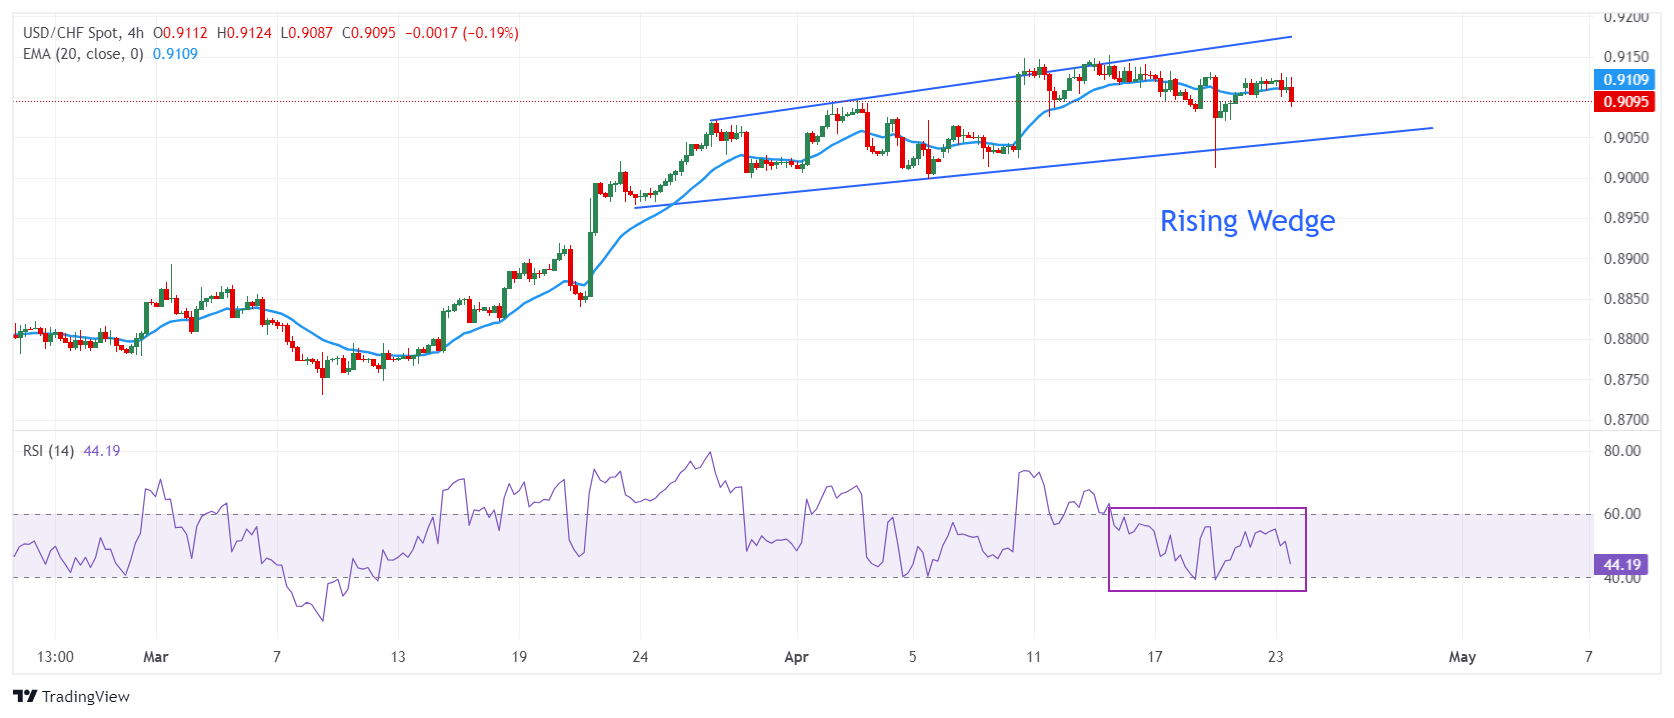
The formation of the USD/CHF pair on a four-hour time frame appears to be a rising wedge pattern, which indicates a limited upside and is usually followed by a breakout move. The 20-period exponential moving average (EMA) at 0.9100 attached to the Swiss Franc asset suggests indecision among market participants.
The 14-period RSI is moving into the 40.00-60.00 range, indicating future consolidation.
Further declines would occur if the asset broke below the psychological support of 0.9000, which would expose it to the March 22 low at 0.8966, followed by the March 1 high at 0.8893.
In an alternative scenario, a bullish move above the April high at 0.9150 would take the pair towards the round support level of 0.9200. Breaking this last level would push the pair towards the October 4, 2023 high at 0.9232.
USD/CHF four-hour chart
Source: Fx Street
I am Joshua Winder, a senior-level journalist and editor at World Stock Market. I specialize in covering news related to the stock market and economic trends. With more than 8 years of experience in this field, I have become an expert in financial reporting.


