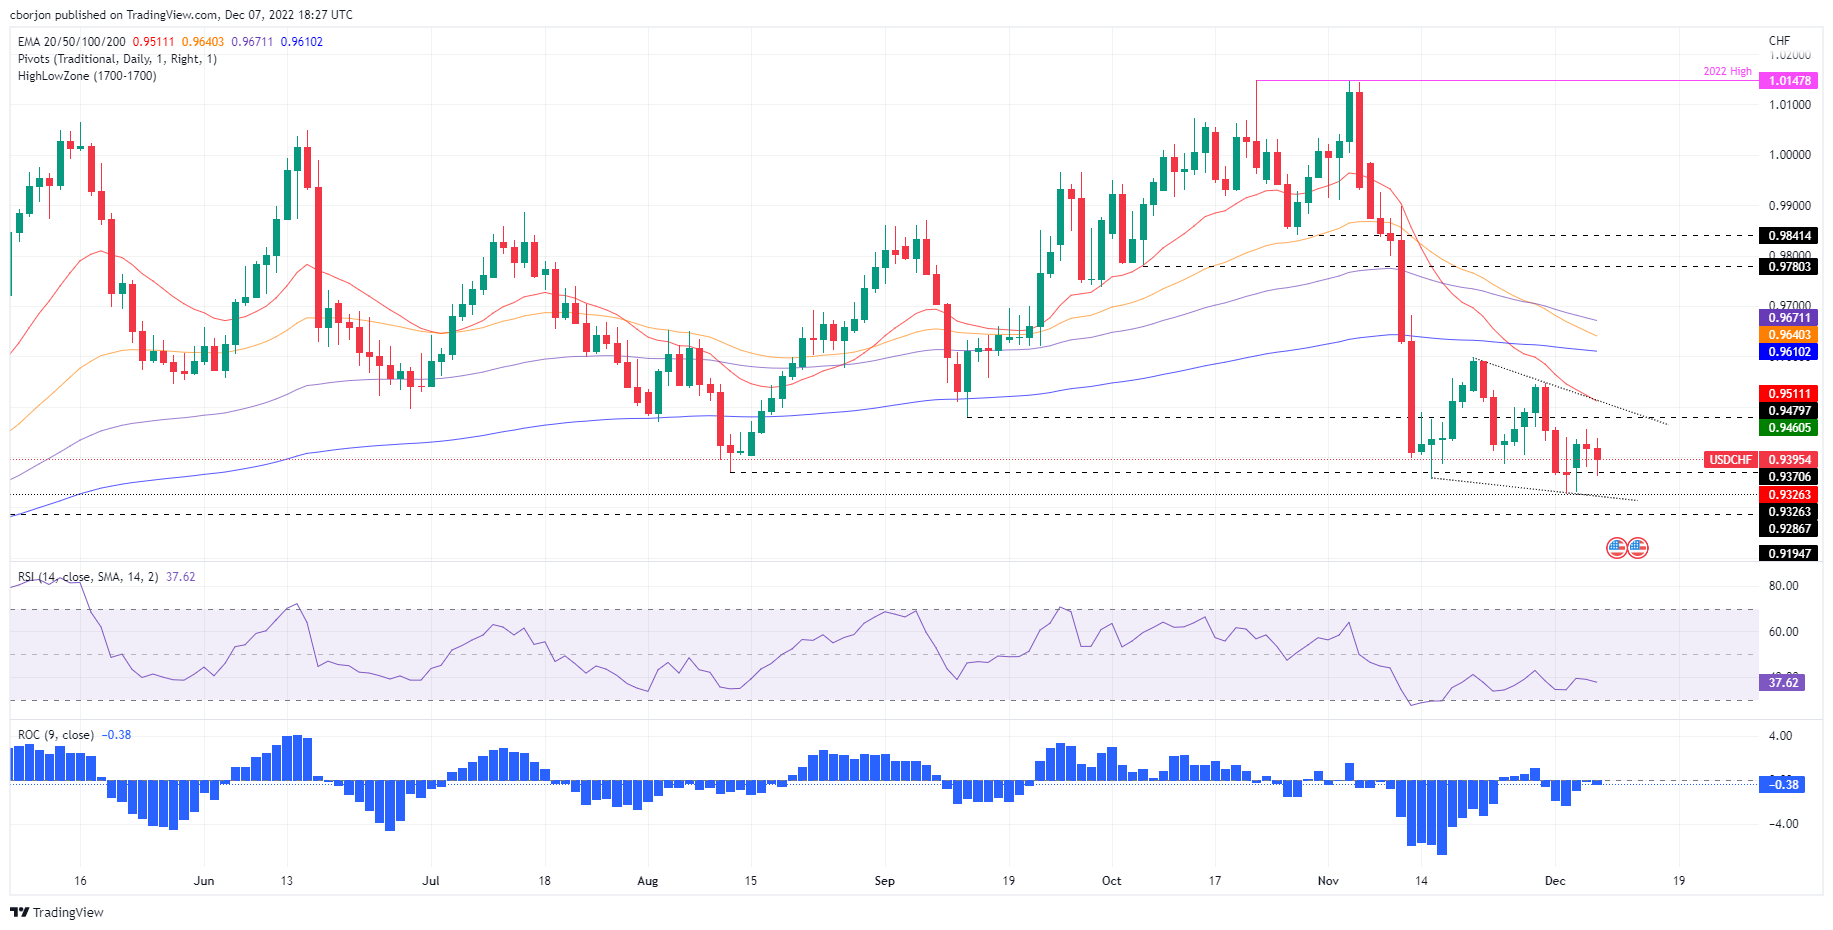
- Widespread US dollar weakness a headwind for USD/CHF.
- A falling wedge on the daily chart for USD/CHF suggests that the pair could break out.
- USD/CHF: A break below 0.9326 could pave the way towards 0.9300; otherwise, a recovery towards 0.9400 is expected.
The USD/CHF continues to lose ground for two consecutive sessions, with a minimum fall of 0.22%, after reaching a daily maximum of 0.9437. At the time of writing, USD/CHF is trading at 0.9396, while the Dollar Index (DXY) is down 0.51%.
USD/CHF Price Analysis: Technical Perspective
From a daily chart perspective, the USD/CHF daily chart suggests that the pair is biased to the downside. Since mid-November, the USD/CHF has formed a falling wedge, a bullish continuation chart pattern, which appeared, following the massive swing from around the 2022 highs at 1.0147, towards last week’s lows at 0.9326. Therefore, USD/CHF could consolidate between the limits of the wedge before breaking higher/lower.
Oscillators are giving mixed signals, with the Relative Strength Index (RSI) pointing lower, while the Rate of Change (RoC) portrays the selling pressure easing. Unless USD/CHF breaks below 0.9326 and challenges to break the wedge to the downside, this could set the stage for a test of 0.9300.
As an alternative scenario, the first resistance of the USD/CHF would be 0.9400, followed by the daily low of September 13 at 0.9479, followed by the upper trend line of the wedge at 0.9505, and the 20-day EMA. at 0.9510.

Key technical levels for USD/CHF
USD/CHF
| Overview | |
|---|---|
| Last price today | 0.9399 |
| Today Change Daily | -0.0018 |
| today’s daily variation | -0.19 |
| today’s daily opening | 0.9417 |
| Trends | |
|---|---|
| daily SMA20 | 0.949 |
| daily SMA50 | 0.9762 |
| daily SMA100 | 0.9701 |
| daily SMA200 | 0.9644 |
| levels | |
|---|---|
| previous daily high | 0.9456 |
| previous daily low | 0.9381 |
| Previous Weekly High | 0.9548 |
| previous weekly low | 0.9326 |
| Previous Monthly High | 1.0148 |
| Previous monthly minimum | 0.9357 |
| Fibonacci daily 38.2 | 0.941 |
| Fibonacci 61.8% daily | 0.9427 |
| Daily Pivot Point S1 | 0.938 |
| Daily Pivot Point S2 | 0.9343 |
| Daily Pivot Point S3 | 0.9304 |
| Daily Pivot Point R1 | 0.9455 |
| Daily Pivot Point R2 | 0.9493 |
| Daily Pivot Point R3 | 0.953 |
Source: Fx Street
I am Joshua Winder, a senior-level journalist and editor at World Stock Market. I specialize in covering news related to the stock market and economic trends. With more than 8 years of experience in this field, I have become an expert in financial reporting.


