
- USD/CHF extends its weekly losses to more than 1%.
- The divergence between the USD/CHF price action and the oscillators could suggest that the selling pressure is fading.
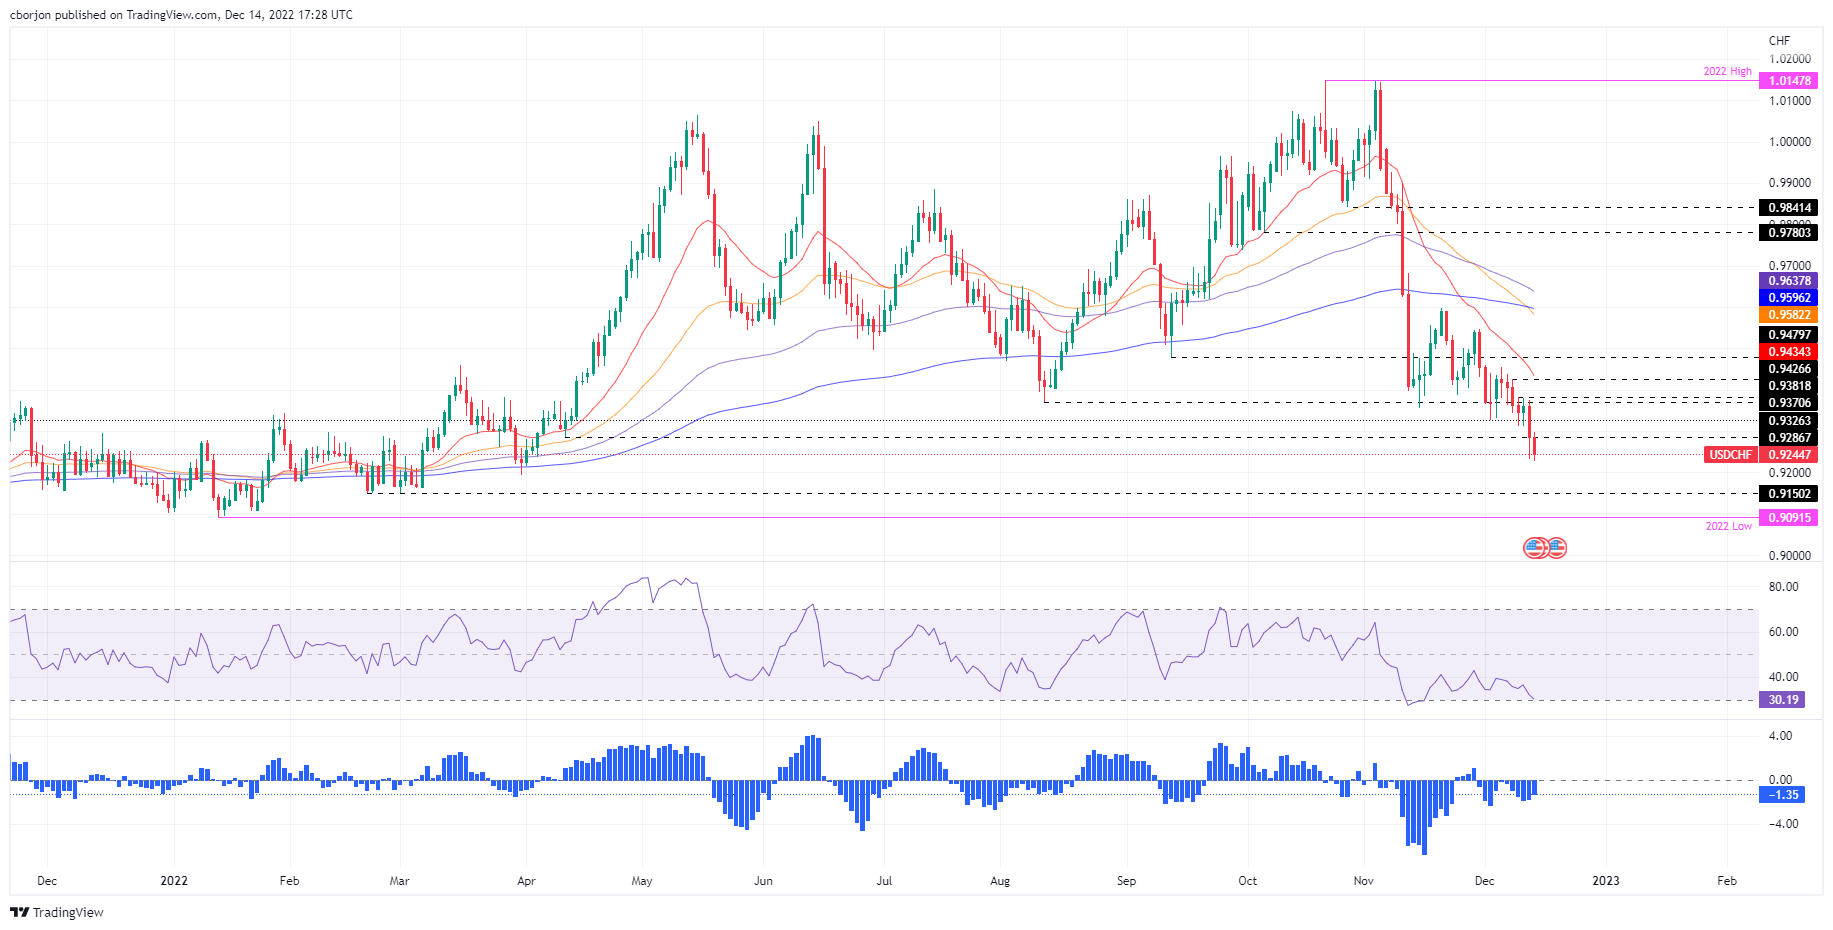
- A break below 0.9200 may exacerbate a fall to yearly lows; otherwise, a recovery above 0.9300 is almost certain.
USD/CHF extends its slide to a fresh seven-month low, ahead of the Federal Reserve’s policy decision, and falls below 0.9300 after Tuesday’s volatile session, showing further US dollar weakness ( USD), stimulated by a soft inflation report. Thus, USD/CHF is down 1.11% so far this week, and 0.47% on Wednesday, trading above 0.9243 as of this writing.
USD/CHF Price Analysis: Technical Perspective
The USD/CHF trend remains bearish, as the daily chart shows, with prices dipping to multi-month lows below 0.9300. It has to be said that oscillators barely reacted to the price action, with the Relative Strength Index (RSI) holding slightly above oversold territory. At the same time, the Rate of Change (RoC) continued to point towards the zero line, suggesting that selling pressure is easing.
If USD/CHF falls below 0.9200, a fall towards the daily low of February 21 at 0.9150 is expected, followed by a retest of the lows of 0.9091. However, with oscillators diverging from USD/CHF price action, the USD/CHF’s first resistance would be the psychological level of 0.9300followed by the daily maximum of December 13 in 0.9375 before the 0.9400 area.
USD/CHF Technical Levels
Source: Fx Street
I am Joshua Winder, a senior-level journalist and editor at World Stock Market. I specialize in covering news related to the stock market and economic trends. With more than 8 years of experience in this field, I have become an expert in financial reporting.


