
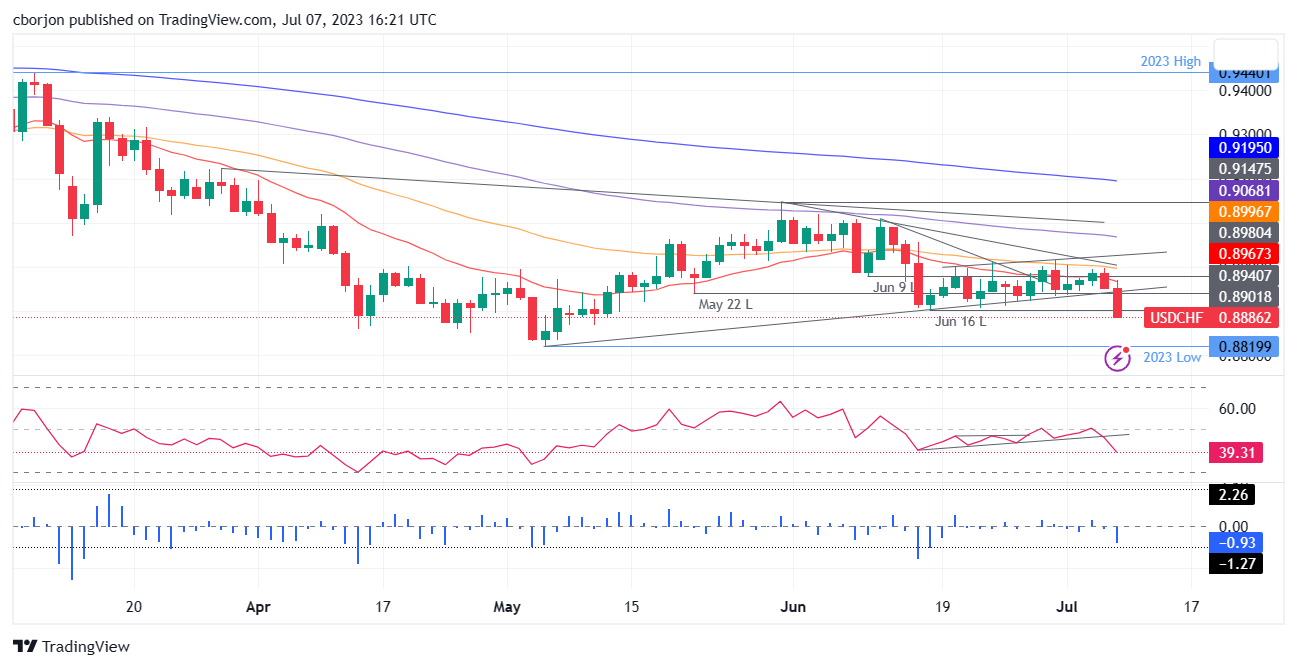
- USD/CHF plunged to two-month lows at 0.8889, shedding 0.72%, on weaker-than-expected US jobs data and a weakening Dollar.
- The pair breaks a two-month support trend line, extending losses below 0.8900.
- The next target is the year-to-date low of 0.8819, waiting to break above the psychological level of 0.8850.
- If the buyers recover 0.8900, initial resistance lies at 0.8950, followed by the 20-day EMA at 0.8967 and the 50-day EMA at 0.8997.
Friday, the USD/CHF It hit a new two-month low, after less encouraging-than-expected labor data from the United States (US) weakened the US dollar (USD). Earlier, USD/CHF hit a daily high of 0.8970, which fell below the 0.8900 figure after the data was released. USD/CHF is trading at 0.8889, down 0.72%.
USD/CHF Price Analysis: Technical Perspective
From a daily chart perspective, USD/CHF extended its losses beyond 0.8900 after breaking a supportive trend line from two months ago. This compounded USD/CHF’s slide below the June 16 swing low at 0.8901, intermediate support opening the door to a test of the year-to-date low at 0.8819. However, USD/CHF must break the psychological level of 0.8850 on its way down.
In particular, the Relative Strength Index (RSI) and the Three-Day Rate of Change (RoC) suggest that sellers are still in command as both turned bearish.
Conversely, if USD/CHF buyers recapture 0.8900, first resistance would emerge at 0.8950. If the latter is broken, USD/CHF could rally to the 20-day EMA at 0.8967, followed by the 50-day EMA at 0.8997. A break of the latter would bring 0.9000 into play.
USD/CHF Price Action – Daily Chart
Source: Fx Street
I am Joshua Winder, a senior-level journalist and editor at World Stock Market. I specialize in covering news related to the stock market and economic trends. With more than 8 years of experience in this field, I have become an expert in financial reporting.


