
- USD/CHF remains below the 20-day EMA, unable to recover 0.9300.
- Although the pair is bearish, solid support for USD/CHF is around 0.9150.
- If the USD/CHF breaks above the 20 day EMA, the 0.93 level will be exposed, followed by the 50 day EMA.
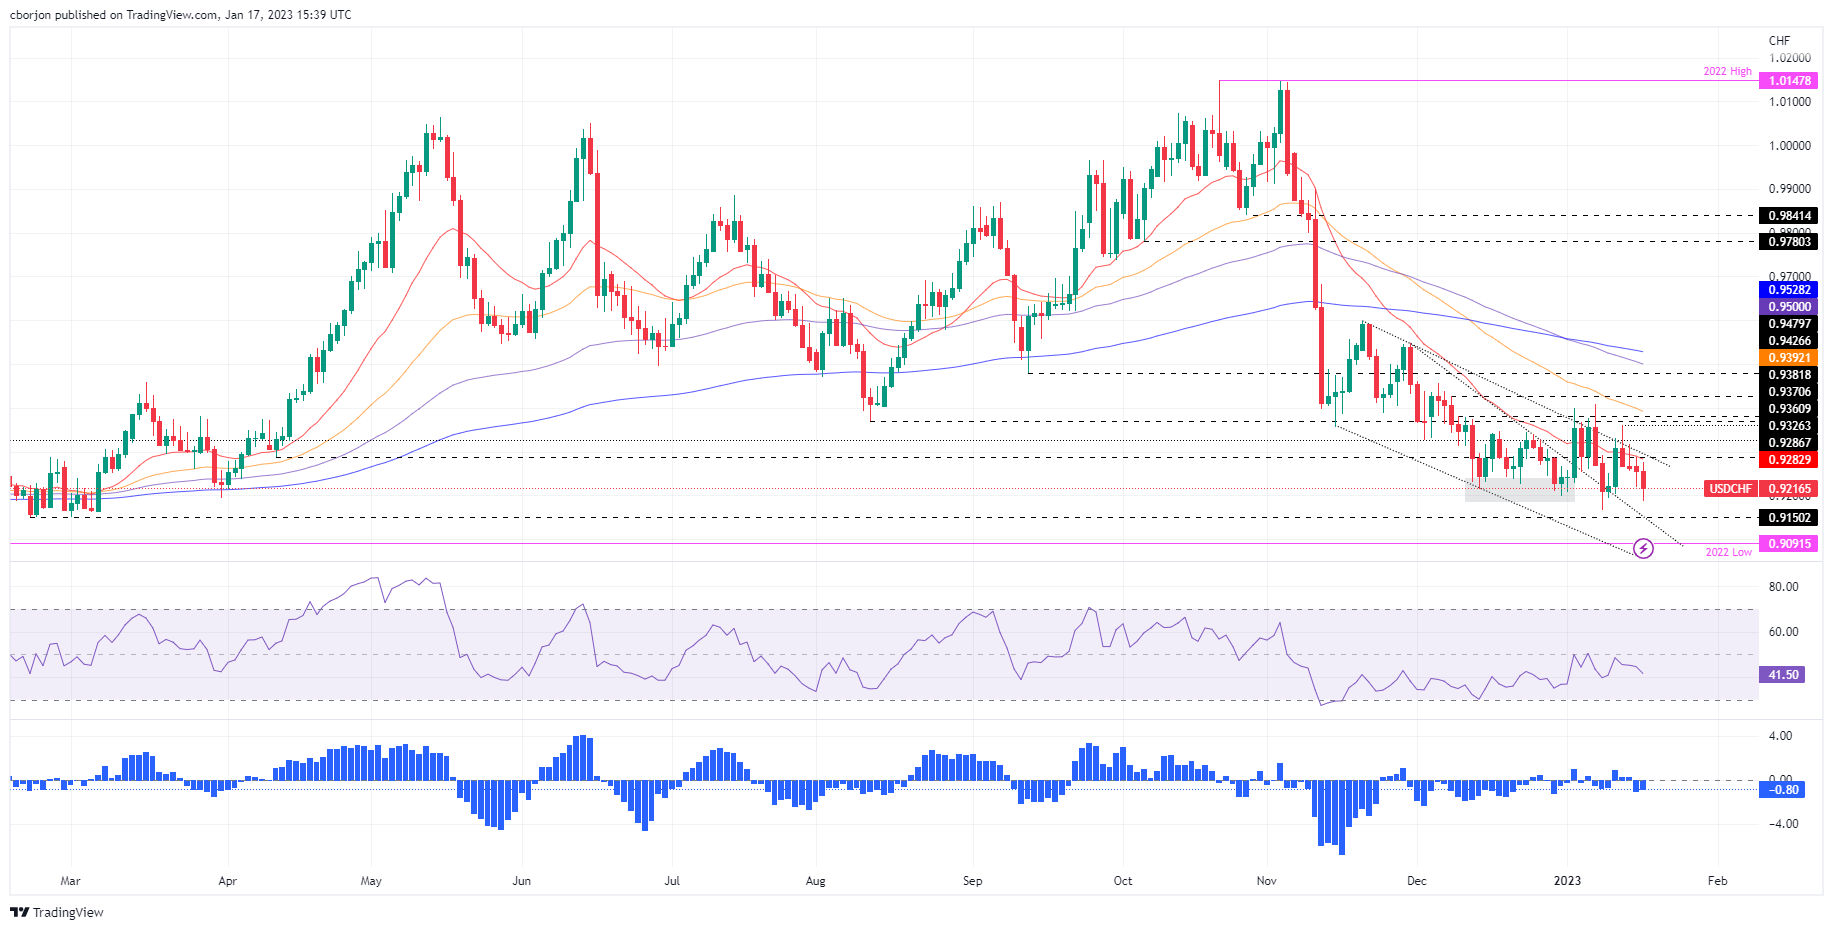
After failing to break above 0.9360 over the past week, the USD/CHF is extending its downtrend to four days in a row, holding just below the 20-day EMA, which sits at around 0.9282, acting as solid resistance. Therefore, USD/CHF is trading at 0.9213, losing 0.44% from its opening price.
USD/CHF Price Analysis: Technical Perspective
USD/CHF has a neutral to bearish bias and continues to trade below the confluence of a three-month-old downtrend line and the 20-day EMA. Although the bias suggests further declines, since December 2022 USD/CHF bottomed around the February 2022 low of 0.9150 and remains unable to break above it. Therefore, the bears need to overcome the latter, to open the door towards 0.9100 first and then 0.9000.
As an alternate scenario, if the USD/CHF pair recaptures the 20-day EMA, the pair could rally to 0.9300, followed by the Jan 12 high of 0.9360, before 0.9400.
Key technical levels for USD/CHF
Source: Fx Street
I am Joshua Winder, a senior-level journalist and editor at World Stock Market. I specialize in covering news related to the stock market and economic trends. With more than 8 years of experience in this field, I have become an expert in financial reporting.


