
- USD/CHF trimmed some of its losses on Tuesday, dipping 0.18% during the session.
- Once USD/CHF broke above the 0.9900 figure, it paved the way for a retest of parity.
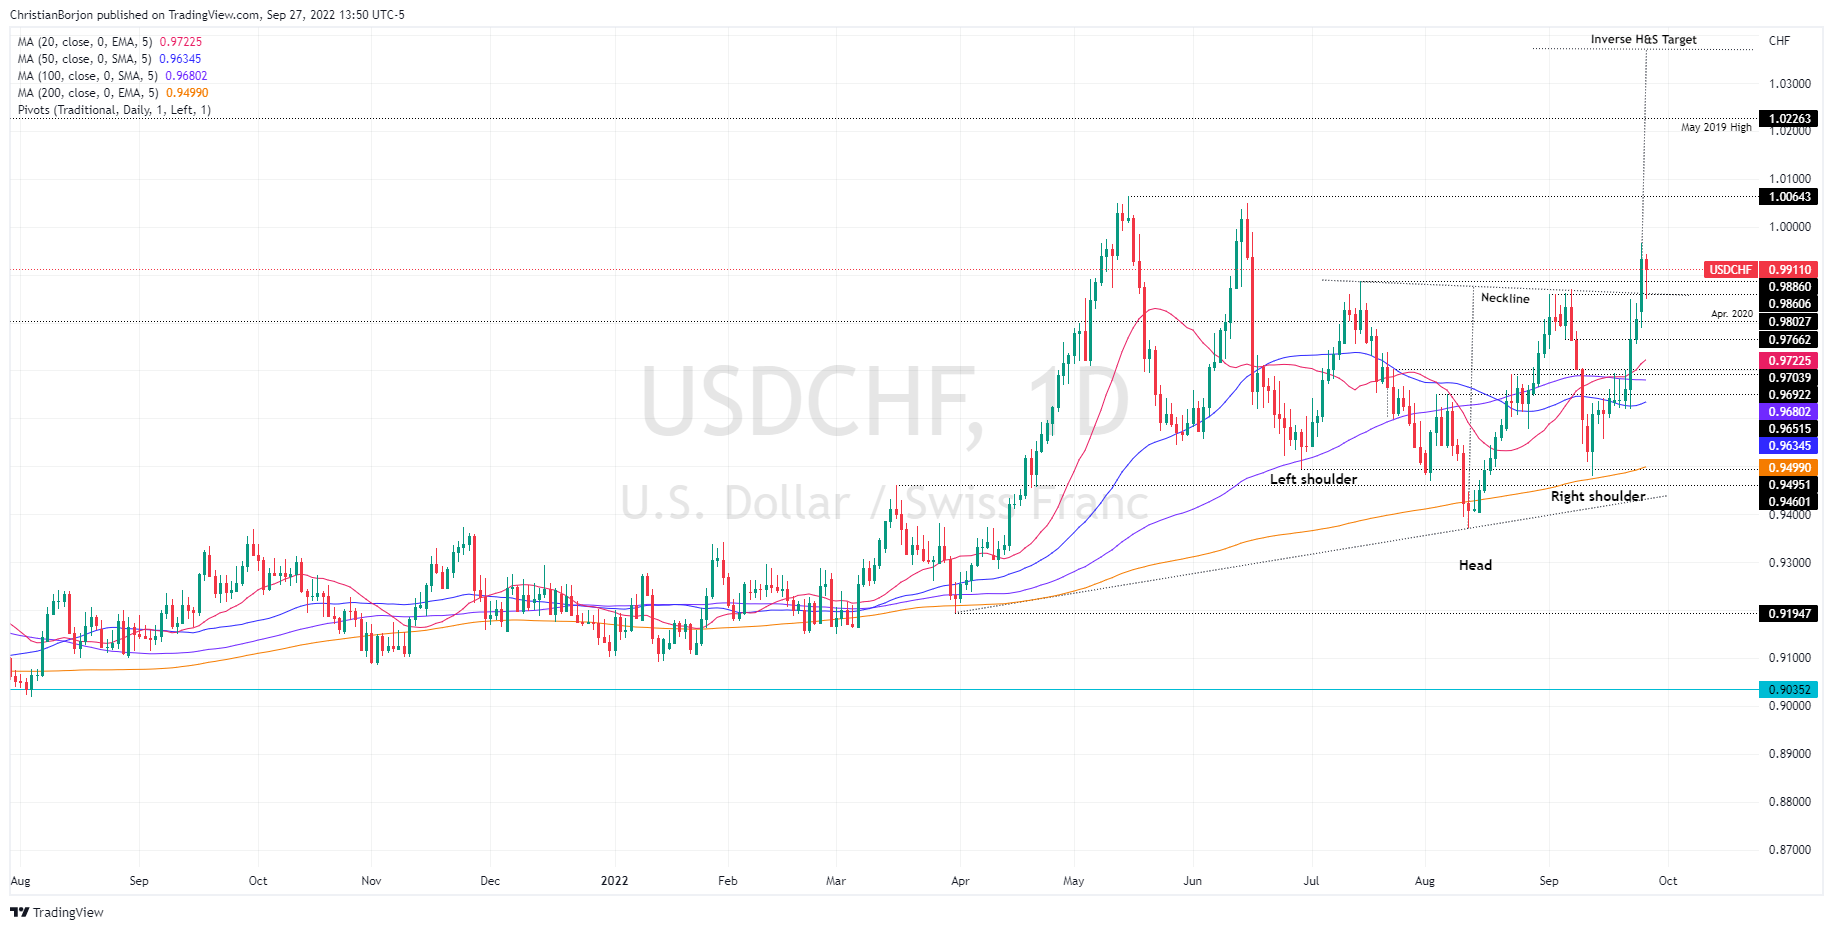
- An inverse head and shoulders on the USD/CHF daily chart, targeting 1.0370.
USD/CHF is paring some of the day’s losses, rebounding from daily lows around 0.9849 and rising above 0.9900, for the second day in a row, as sentiment turns negative, with the SP500 hitting a fresh two-week low. years during the day. At the time of writing, USD/CHF is trading at 0.9913, down 0.18% slightly.
USD/CHF Price Analysis: Technical Outlook
The USD/CHF daily chart is showing an uptrend, which will consolidate once it breaks above the July 14 high of 0.9886. Earlier in the day, USD/CHF sellers attempted to recapture the latter, but buying pressure outpaced sellers, with USD/CHF breaking above 0.9900. Also note that there is an inverse head and shoulders chart pattern emerging, which could pave the way for further gains.
If USD/CHF breaks above parity, the season high of 1.0064 could be at stake. Once broken, the next resistance level would be 1.0100, followed by the May 2019 swing high at 1.0226, before the inverse head and shoulders target at 1.0369.
Key USD/CHF Technical Levels
Source: Fx Street
With 6 years of experience, I bring to the table captivating and informative writing in the world news category. My expertise covers a range of industries, including tourism, technology, forex and stocks. From brief social media posts to in-depth articles, I am dedicated to creating compelling content for various platforms.


