
- USD/CHF rebounds from weekly lows to end the week with gains of 0.73%.
- From a daily chart point of view, USD/CHF has nowhere to go; probably remain in consolidation.
- In the short term, a symmetrical triangle on the 4-hour chart of USD/CHF points to 0.9767.
The USD/CHF rallies after hitting weekly lows around 0.9577 earlier in the day and is about to erase Thursday’s losses as USD/CHF heads towards the 100-DMA, following aggressive comments from the chairman of the US Federal Reserve, Jerome Powell. USD/CHF is trading at 0.9659, up nearly 0.20%.
USD/CHF Price Analysis: Technical Outlook
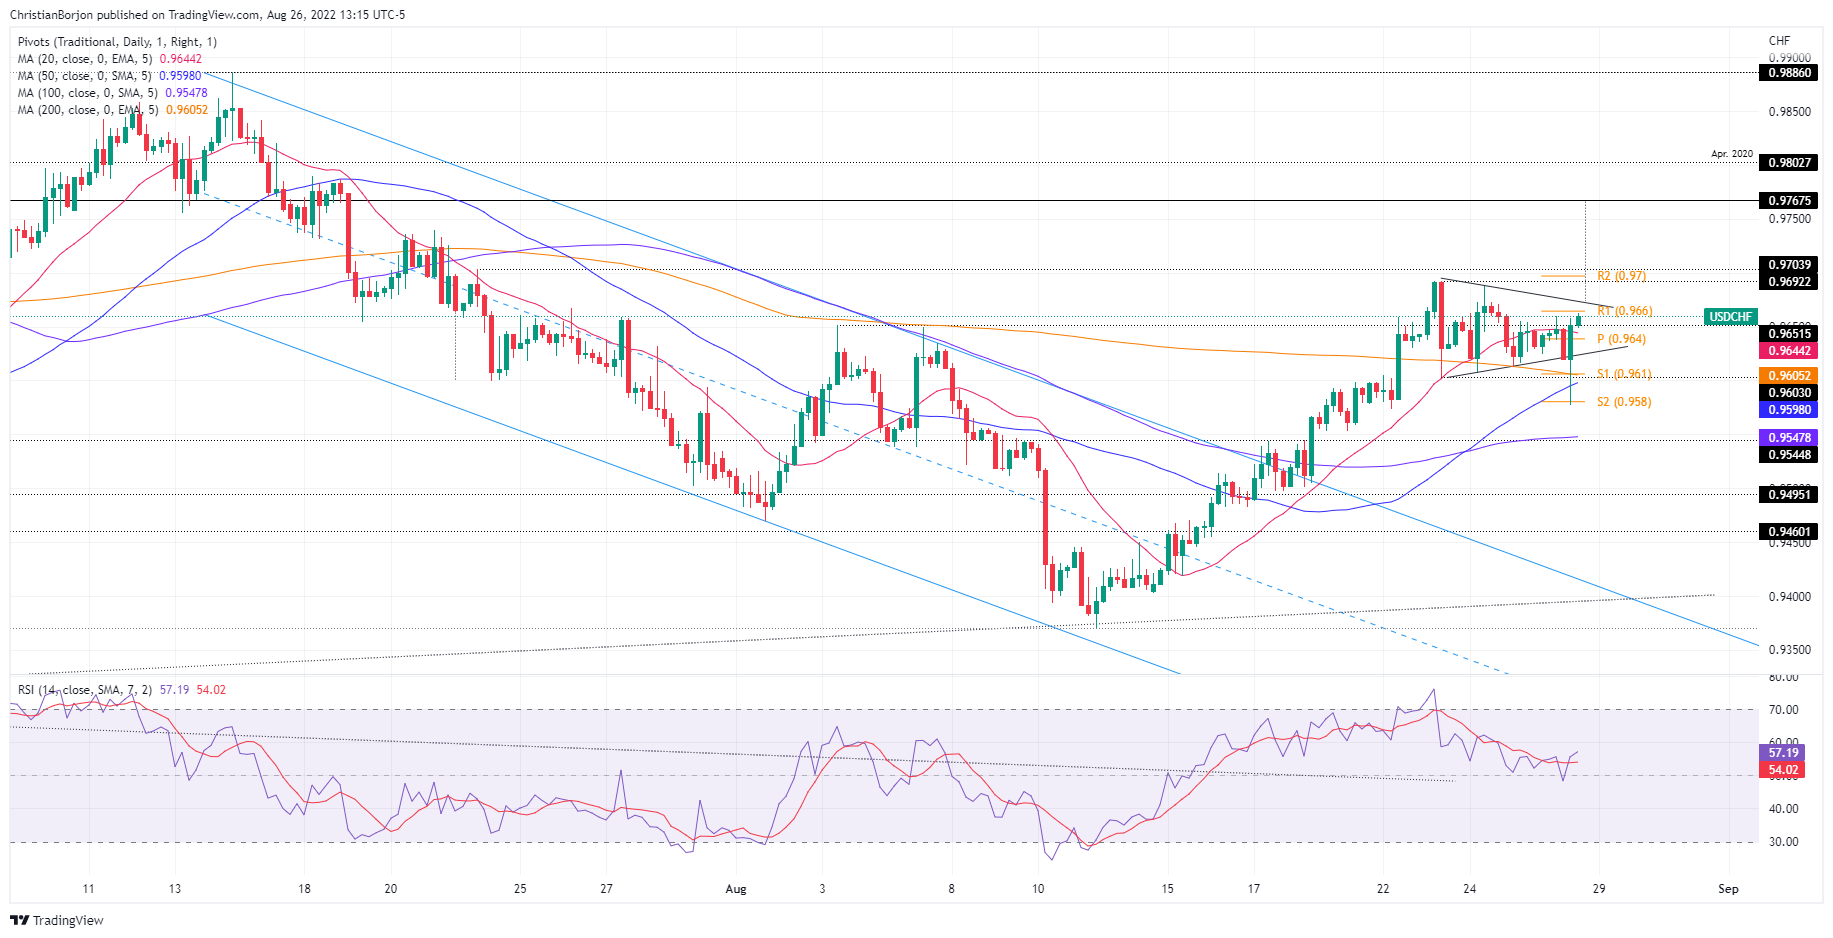
Consolidation on the daily chart will keep USD/CHF trading within the 0.9600-0.9690 range, as this week’s price action shows. It is worth noting that the support/resistance levels are the 100 and 50 day EMAs, each at 0.9657 and 0.9614, respectively. Therefore, unless the exchange rate decisively breaks above/below the range, USD/CHF could remain subdued.
In the short term, the USD/CHF 4-hour scale shows the formation of a symmetrical triangle in an uptrend, which was “falsely” broken lower on Fed Powell’s comments, although it closed inside the top-bottom of the trend lines. Furthermore, the USD/CHF bias is neutral to bullish, confirmed by the moving averages residing below the spot price, while the Relative Strength Index (RSI) became the forensic one and started to head higher in positive territory.
Therefore, the first resistance of the USD/CHF would be the upper trend line of the symmetrical triangle. A break above it will expose the confluence of the R2 pivot point and the 0.9700 figure. Once broken, the next supply zone would be the height of the symmetrical triangle, targeting 0.9767, followed by the psychological mark of 0.9800.
Key USD/CHF Technical Levels
Source: Fx Street
With 6 years of experience, I bring to the table captivating and informative writing in the world news category. My expertise covers a range of industries, including tourism, technology, forex and stocks. From brief social media posts to in-depth articles, I am dedicated to creating compelling content for various platforms.


