- The US dollar continues to be offered, except against the Swiss franc, as USD/CHF rises.
- USD/CHF: A daily close above 0.9425 will pave the way for a test of 0.9500.
The US dollar (USD) is recovering slightly against the Swiss franc (CHF) after the release of the minutes of the November meeting of the Federal Reserve (Fed), which show the desire of policymakers to moderate interest rate hikes. Therefore, the USD/CHF tanked on Wednesday, but the story was different on Thursday. At time of writing, USD/CHF is trading at 0.9434, after hitting daily lows at 0.9387.
USD/CHF Price Analysis: Technical Perspective
The USD/CHF daily chart shows Thursday’s price action forming a hammer, a candlestick that appears as a reversal pattern. However, as with most technical analysis tools, this is only one piece of the puzzle as you will need further confirmation from Friday. The Relative Strength Index (RSI) shows that sellers are in control, but its slope is heading higher, indicating that they may be losing momentum. If USD/CHF achieves a daily close above 0.9425 on Wednesday, that could open the door for a retest of 0.9500. Otherwise, sellers outpace buyers and could push the pair towards 0.9400 before testing the November low at 0.9356.
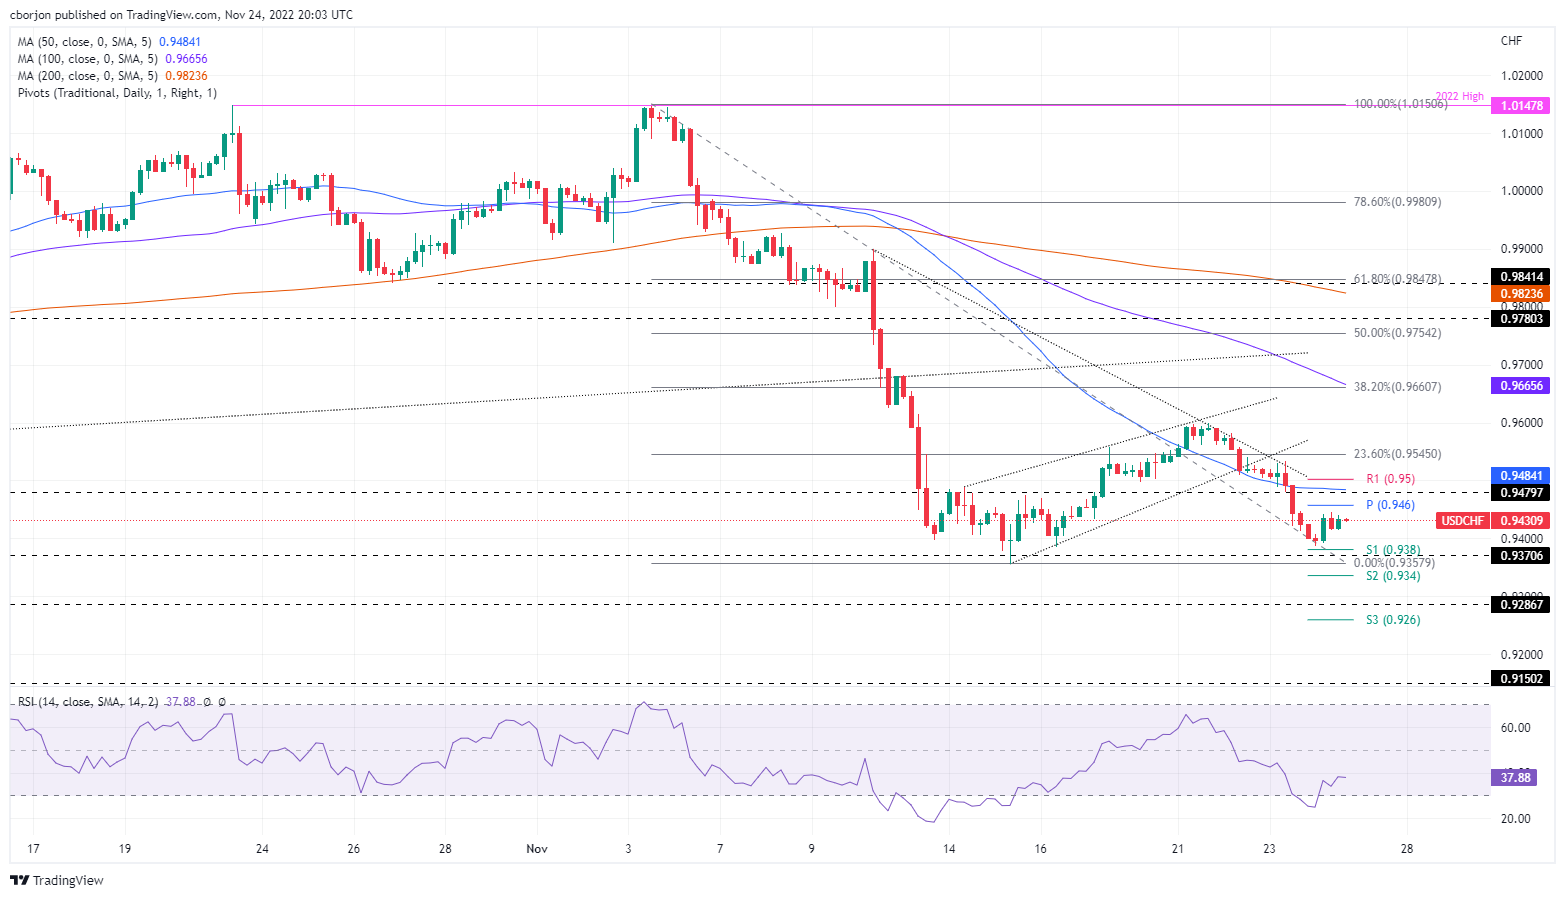
In the short term, the 4-hour chart for USD/CHF shows the main skewed to the downside once it broke above an uptrend line on Nov. 22, compounding the slide below 0.9500. On its way to a fresh weekly low below 0.9400, USD/CHF broke above the 50 EMA along with the daily pivot point at 0.9460. However, the USD/CHF S1 daily pivot at 0.9381 probed stiff support to break it, and the pair rose back above 0.9400.
Therefore, the first resistance for USD/CHF would be the daily pivot at 0.9460, followed by the 50 EMA at 0.9484, before the psychological signal at 0.9500. As an alternate scenario, USD/CHF first support would be 0.9400, followed by the S1 pivot level at 0.9381, before the November low of 0.9356.

Key USD/CHF Technical Levels
USD/CHF
| Overview | |
|---|---|
| Last price today | 0.9435 |
| Today I change daily | 0.0015 |
| Today’s daily change in % | 0.16 |
| today’s daily opening | 0.942 |
| Trends | |
|---|---|
| daily SMA20 | 0.9727 |
| daily SMA50 | 0.9816 |
| daily SMA100 | 0.9731 |
| daily SMA200 | 0.9633 |
| levels | |
|---|---|
| previous daily high | 0.9533 |
| previous daily low | 0.9412 |
| Previous Weekly High | 0.9558 |
| previous weekly low | 0.9357 |
| Previous Monthly High | 1.0148 |
| Previous monthly minimum | 0.9781 |
| Daily Fibonacci of 38.2% | 0.9459 |
| Daily Fibonacci of 61.8% | 0.9487 |
| Daily Pivot Point S1 | 0.9377 |
| Daily Pivot Point S2 | 0.9334 |
| Daily Pivot Point S3 | 0.9256 |
| Daily Pivot Point R1 | 0.9498 |
| Daily Pivot Point R2 | 0.9576 |
| Daily Pivot Point R3 | 0.9619 |
Source: Fx Street
I am Joshua Winder, a senior-level journalist and editor at World Stock Market. I specialize in covering news related to the stock market and economic trends. With more than 8 years of experience in this field, I have become an expert in financial reporting.


