
- The USD/CHF pair could head for a bullish correction despite hitting fresh lows.
- If the buyers recapture the 20-day EMA at 0.8955, expect further gains in the USD/CHF pair.
- The USD/CHF pair risks falling towards 0.8800 once it breaks below 0.8819.
swiss franc (CHF) hit a new year-to-date high against the US dollar (USD), while USD/CHF fell towards 0.8819, a year-to-date low, as risk aversion weighed on markets. However, the dollar unraveled its previous losses and the USD/CHF pair reversed its trend, holding the gains. At the time of writing, the USD/CHF pair is trading at 0.8858 and gaining 0.20% on the day.
USD/CHF Price Action
Even though the pair hit new lows, and USD/CHF price action fell to a lower low, technically speaking, USD/CHF could be headed for a bullish correction. The Relative Strength Index (RSI) is in bearish territory, albeit creating a series of successive higher lows at each USD/CHF lower low. Therefore, a positive divergence is emerging, which could pave the way for further upside.
For this to happen, buyers of the USD/CHF need to recapture the 20-day EMA at 0.8955. Once broken, the pair should recover above the May 2 high of around 0.9000. A decisive break of the figure would expose another level of resistance at the 50-day EMA at 0.9067 before buyers can claim 0.9100.
Conversely, if USD/CHF falls below 0.8819, a drop towards 0.8800 is anticipated.
USD/CHF Daily Chart
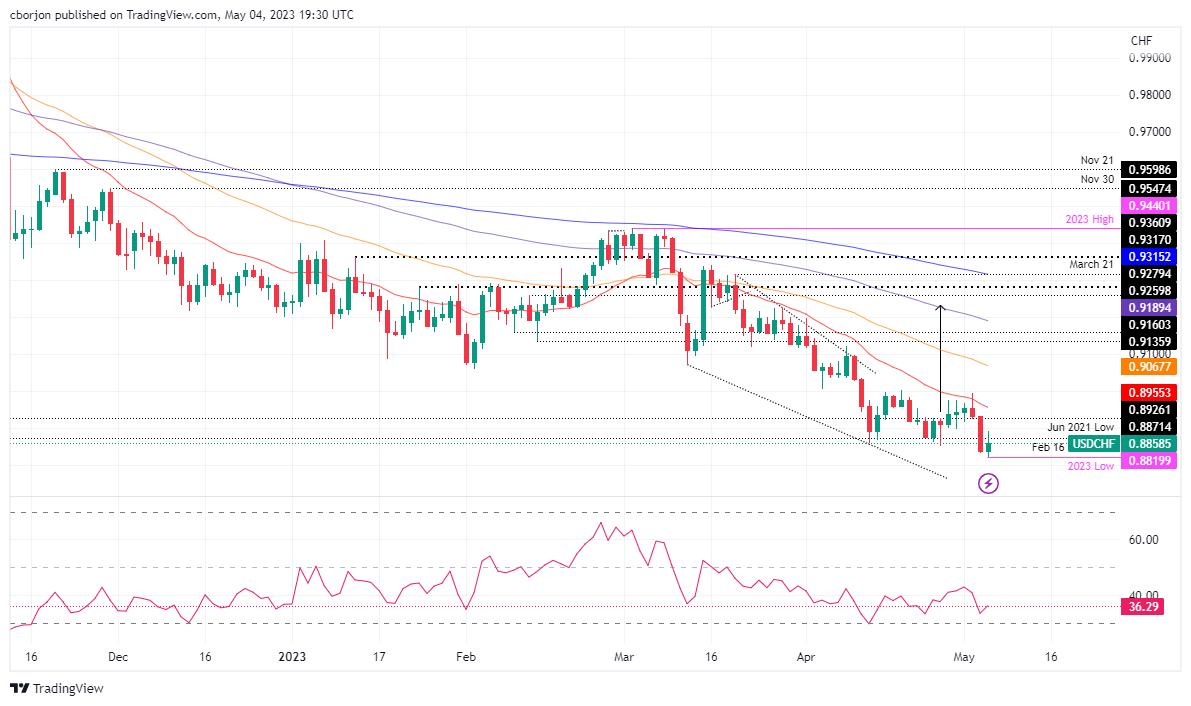
Source: Fx Street
I am Joshua Winder, a senior-level journalist and editor at World Stock Market. I specialize in covering news related to the stock market and economic trends. With more than 8 years of experience in this field, I have become an expert in financial reporting.


