
- USD/CHF pulls back from 0.9886 in a volatile session, despite positive US data.
- The Swiss franc has gained almost 1% in the last two days.
- USD/CHF Price Analysis: Sellers are eyeing 0.9700 which would open the door for buyers to lift the pair towards 0.9800.
The USD/CHF falls after reaching a weekly high on Thursday, around 0.9900, and slumps towards the 0.9770 area after encouraging data from the United States, which reduced expectations of a higher than expected Federal Reserve rate hike , which was applauded by investors, as reflected in the rise in global stocks.
USD/CHF is quoting at 0.9775, close to daily lows, having hit a daily high of 0.9840, just above the daily pivot, which once broken paved the way for a free fall below 0.9800, and extending towards the S1 pivot area around 0.9773.
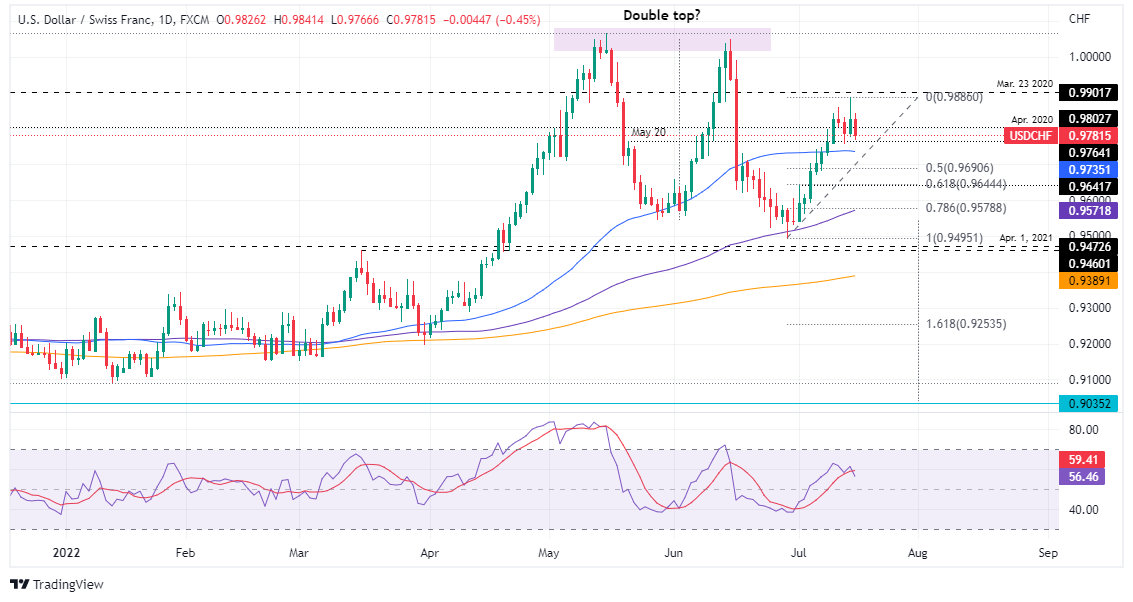
USD/CHF Price Analysis: Technical Outlook
USD/CHF daily chart
The USD/CHF daily chart shows that it continues to favor the longs. The ongoing pullback from weekly highs near 0.9900 could be capped around the 50-day moving average (DMA) at 0.9735, although the Relative Strength Index (RSI) at 56.03 continues to push lower, which means that sellers could be eyeing the Fibonacci 50% retracement around 0.9690, waiting for a RSI rally, which could give buyers an opportunity, to re-enter the USD/CHF longs.
If this scenario plays out, the first resistance of the USD/CHF would be 0.9700, followed by 0.9735 and 0.9800. Otherwise, the USD/CHF retracement could continue its slide towards the 61.8% Fibonacci level at 0.9644, followed by the 0.9600 figure.
Technical levels
Source: Fx Street
With 6 years of experience, I bring to the table captivating and informative writing in the world news category. My expertise covers a range of industries, including tourism, technology, forex and stocks. From brief social media posts to in-depth articles, I am dedicated to creating compelling content for various platforms.


