
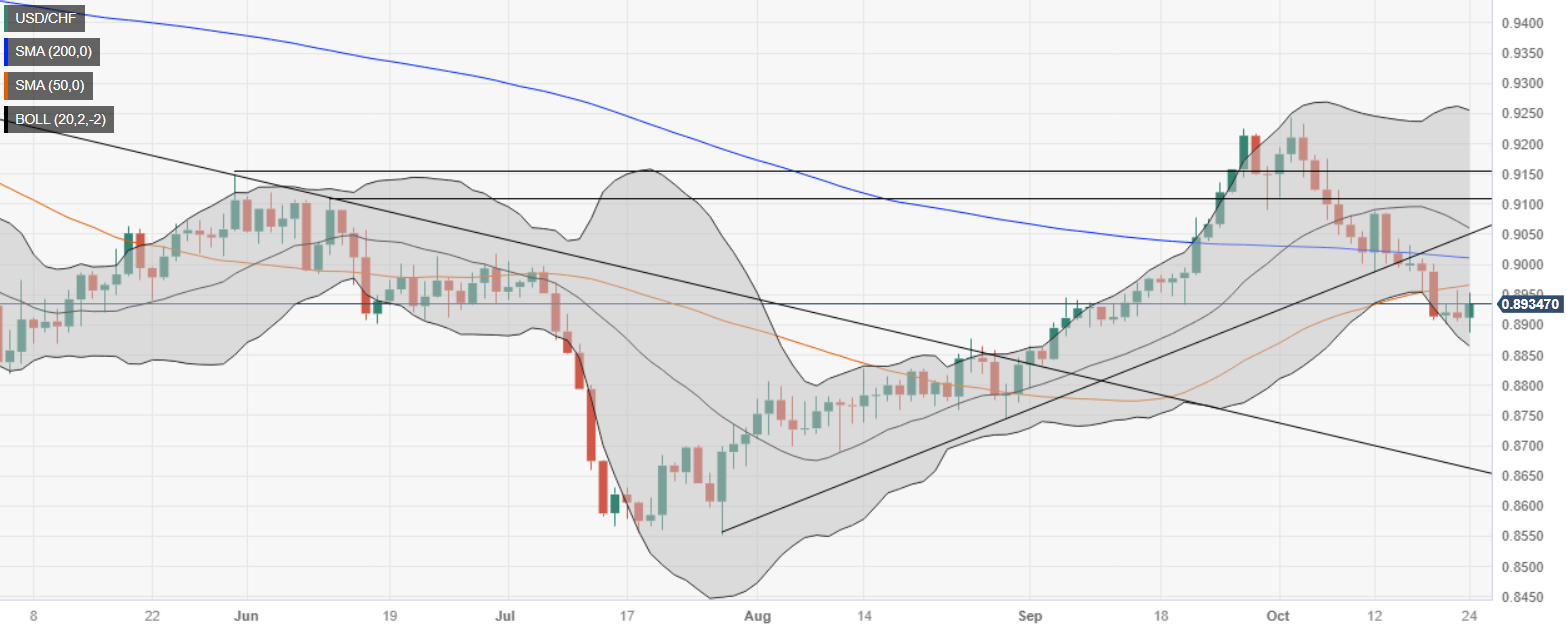
- USD/CHF posts solid gains, bouncing from a weekly low at 0.8878 to trade at 0.8936.
- Breaking the 50-DMA at 0.5965 could test the 200-DMA at 0.9009.
- The first support levels are at 0.8900 and the October 23 low at 0.8878, with additional supports at 0.8819 and 0.8800.
USD/CHF is advancing steadily, posting solid gains of 0.33%, after bouncing from the weekly low of 0.8878. Encouraging data from the United States (US) strengthened the Dollar and lifted the major pair above the 0.8900 figure, which is currently trading at 0.8936.
From a daily chart perspective, after falling below the 50-day moving average (DMA) at 0.5965, the downtrend remains intact unless USD/CHF breaks the latter, which could put a test in play. of the 200 DMA at 0.9009. Once broken, USD/CHF could head towards 0.9100.
On the contrary, and along the path of least resistance, the first support for USD/CHF would be 0.8900, followed by the October 23 low at 0.8878. If sellers reclaim those levels, the next stop would be the August 30 swing low at 0.8819, ahead of 0.8800.
USD/CHF Price Action – Daily Chart
USD/CHF technical levels
Source: Fx Street
I am Joshua Winder, a senior-level journalist and editor at World Stock Market. I specialize in covering news related to the stock market and economic trends. With more than 8 years of experience in this field, I have become an expert in financial reporting.


