
- USD/CHF misses a doji and falls below 0.9300.
- USD/CHF price action suggests the pair could form a triple bottom, but oscillators point lower.
- A drop below 0.9200 could exacerbate a test of the 2022 lows.
The USD/CHF it ignored a doji formed on Wednesday and extended its losses below 0.9300. At the time of writing these lines, USD/CHF is trading at 0.9231, down 0.58%.
USD/CHF Price Analysis: Technical Perspective
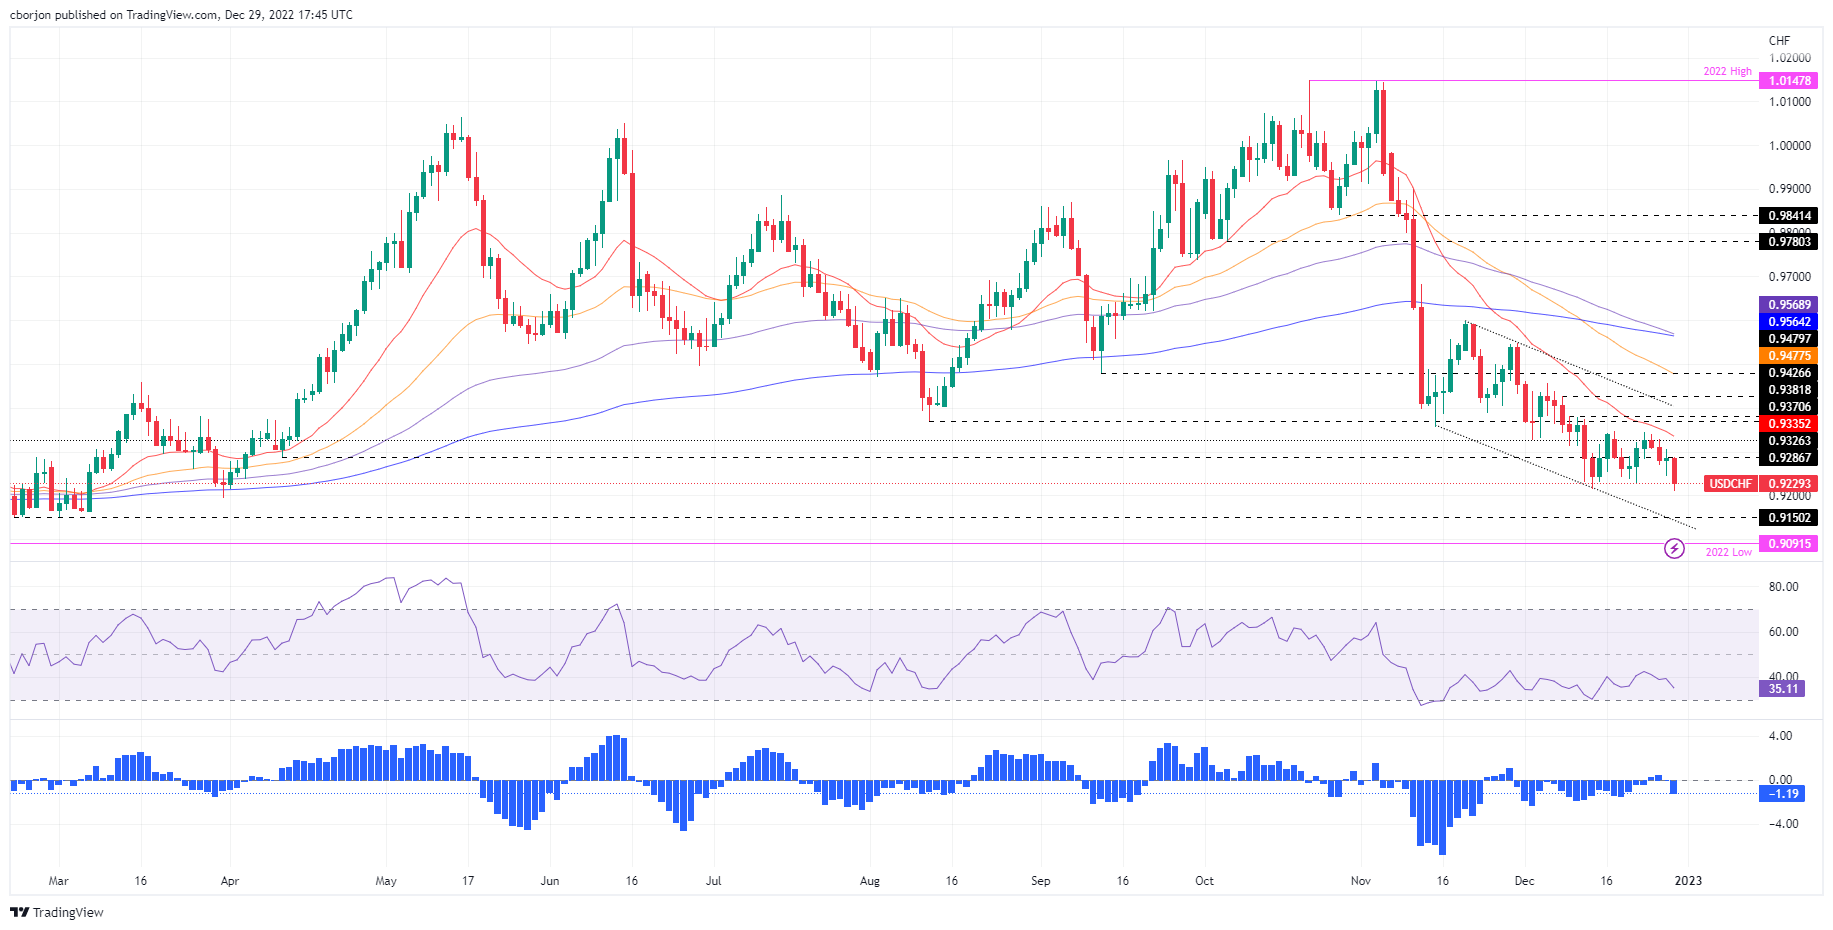
The daily chart shows that USD/CHF hit a daily low of 0.9210 for the third time in December, although it has held on to the 0.9200 level so far. However, the Relative Strength Index (RSI) and the Rate of Change (RoC) suggest that sellers are gathering momentum. Therefore, a drop below the 0.9200 figure could pave the way towards the 2022 yearly low at 0.9091.
Otherwise, USD/CHF could be forming a triple bottom pattern, but would first need to break above the 20-day EMA at 0.9335 and the December high at 0.9347 to confirm the chart pattern. Once reached, the USD/CHF target would be the 50-day EMA at 0.9477, followed by 0.9500.
Key technical levels for USD/CHF
Source: Fx Street
I am Joshua Winder, a senior-level journalist and editor at World Stock Market. I specialize in covering news related to the stock market and economic trends. With more than 8 years of experience in this field, I have become an expert in financial reporting.


