
- USD/CHF remains negative on the week, shedding 1.16%.
- The positive market mood dissuaded USD/CHF sellers from confirming the double top chart pattern.
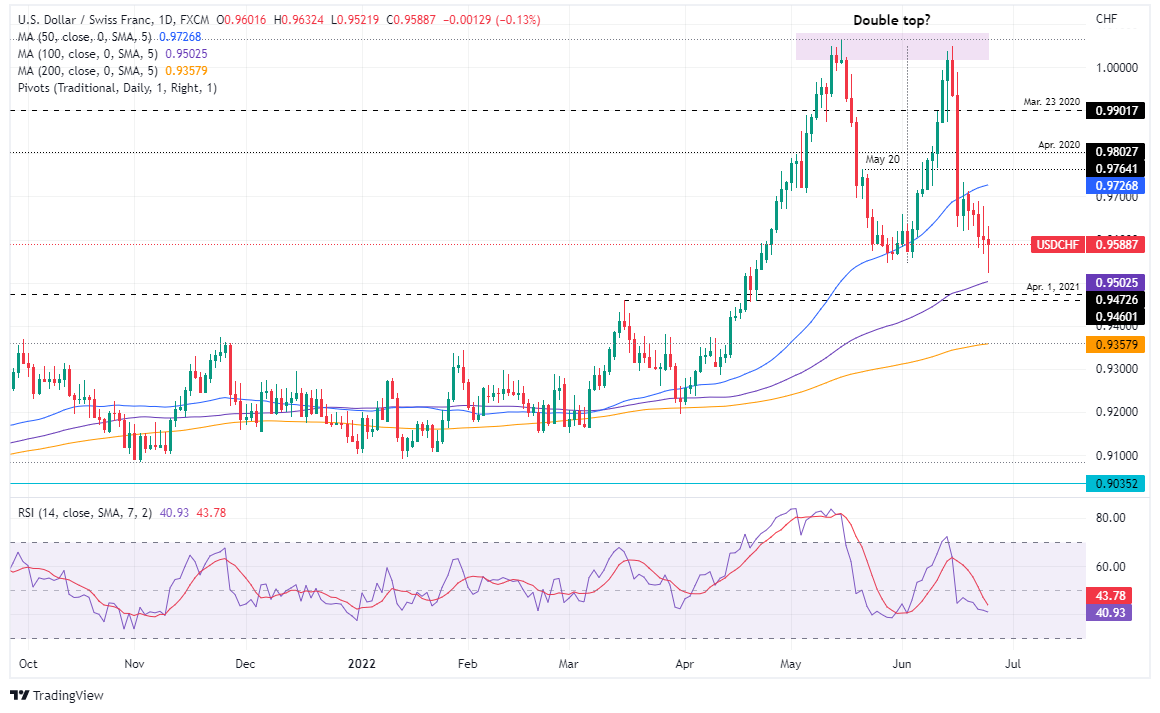
- USD/CHF Price Analysis: Double top still in play but USD/CHF needs to keep spot prices below 0.9600.
The USD/CHF falls for the fifth consecutive day, although it rebounded from the weekly lows reached during the day near 0.9521, towards the 0.9580 zone, far from recovering 0.9600. At 0.9589, USD/CHF lost 0.13% on Friday, extending its weekly losses to 1.16%.
The market mood remains bullish as US stocks post gains of between 2.13% and 2.47%. That’s because the University of Michigan’s inflation expectations are down from a 14-year high, meaning the Federal Reserve needs to tighten monetary policy, but not as expected by market players, who now expect the federal funds rate (FFR) is close to 3.50%. Also, US recession fears eased as St. Louis Fed President James Bullard said concerns are overblown.
USD/CHF, meanwhile, opened above 0.9600 and rallied towards Friday’s daily high, then pulled back to daily lows near 0.9521, although it settled around the 0.9580 area of late.
USD/CHF Price Analysis: Technical Outlook
daily chart
USD/CHF remains in an uptrend, but remains trapped between the 50 and 100 day moving averages (DMA). It is worth noting that the major formed a double top on the daily time frame, but still requires a daily close below the May 27 swing low of 0.9544 to validate the pattern.
Therefore, a USD/CHF daily close below 0.9544 would open the door to the 100 DMA at 0.9502. A break below would expose 0.9400, followed by the 200 DMA at 0.9357.
However, if the uptrend resumes, the first resistance for USD/CHF would be 0.9600. A break of the latter would expose the 0.9700 figure, followed by the 50 DMA at 0.9772, and then a test of the June 16 daily high at 0.9989.
Technical levels
USD/CHF
| Panorama | |
|---|---|
| Last Price Today | 0.959 |
| Today’s Daily Change | -0.0024 |
| Today’s Daily Change % | -0.25 |
| Today’s Daily Opening | 0.9614 |
| Trends | |
|---|---|
| 20 Daily SMA | 0.9717 |
| 50 Daily SMA | 0.9728 |
| 100 Daily SMA | 0.9503 |
| 200 Daily SMA | 0.936 |
| levels | |
|---|---|
| Previous Daily High | 0.9679 |
| Previous Daily Minimum | 0.9566 |
| Previous Maximum Weekly | 1,005 |
| Previous Weekly Minimum | 0.9619 |
| Monthly Prior Maximum | 1.0064 |
| Previous Monthly Minimum | 0.9545 |
| Daily Fibonacci 38.2% | 0.9636 |
| Daily Fibonacci 61.8% | 0.9609 |
| Daily Pivot Point S1 | 0.9561 |
| Daily Pivot Point S2 | 0.9507 |
| Daily Pivot Point S3 | 0.9448 |
| Daily Pivot Point R1 | 0.9673 |
| Daily Pivot Point R2 | 0.9732 |
| Daily Pivot Point R3 | 0.9786 |
Source: Fx Street
With 6 years of experience, I bring to the table captivating and informative writing in the world news category. My expertise covers a range of industries, including tourism, technology, forex and stocks. From brief social media posts to in-depth articles, I am dedicated to creating compelling content for various platforms.


