
- USD/CHF recovers the 0.9700 figure, advancing towards the 0.9800 mark, up 0.70%.
- USD/CHF Price Analysis: Daily Close Above 0.9740 Opens Path To 0.9900; otherwise, a drop to 0.9600 is anticipated.
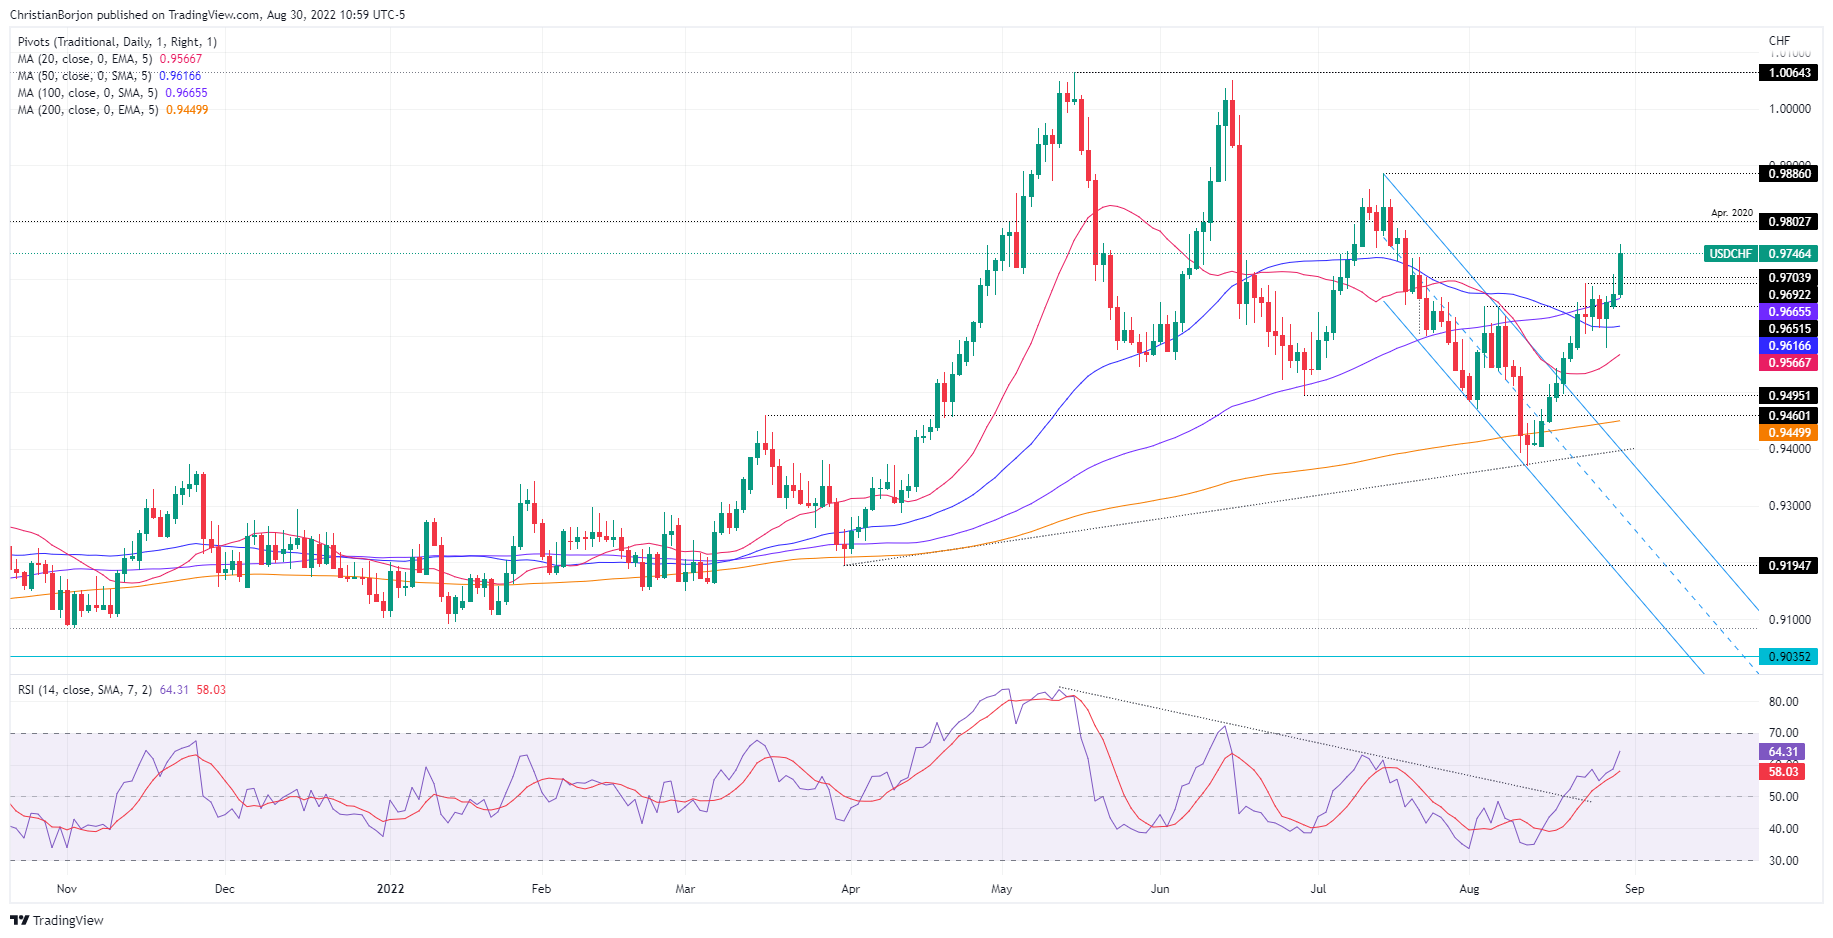
The USD/CHF rises during the North American session, reaching a six-week high around 0.9762, falling below the 20-day EMA, widening the gap from the long-term daily moving averages (DMA). At the time of writing, it is trading at 0.9746, up 0.70%.
USD/CHF Price Analysis: Technical Outlook
The weekly chart of USD/CHF shows that the pair extended its gains above the 20 EMA at 0.9676 after Monday’s unsuccessful breakout. Furthermore, the Relative Strength Index (RSI) crossed above the 7-week SMA of the RSI, pointing higher, showing that the buyers are gaining momentum. Therefore, the USD/CHF resumes its bullish bias in the short term.
The daily chart of the USD/CHF illustrates the bounce off the 100 day EMA, following the failure on Monday, and extended its gains to hit a daily high at 0.9762 before pulling back towards current price levels, just above the high of the July 21 at 0.9739. If USD/CHF makes a daily close below the latter, a pullback towards 0.9600 is expected. Otherwise, USD/CHF could continue its way north towards the 0.9886 level before the key psychological level 0.9900.
Therefore, the first resistance for USD/CHF would be the 0.9800 figure, followed by the daily high of July 14 at 0.9886, before the psychological mark of 0.9900. On the other hand, the first support of the USD/CHF would be the figure of 0.9700. Once broken through, the next demand zone would be the 100 day EMA at 0.9665, followed by the 50 day EMA at 0.9616, and then the daily low of 26 Aug at 0.9577.
Key USD/CHF Technical Levels
Source: Fx Street
With 6 years of experience, I bring to the table captivating and informative writing in the world news category. My expertise covers a range of industries, including tourism, technology, forex and stocks. From brief social media posts to in-depth articles, I am dedicated to creating compelling content for various platforms.


