
- USD/CHF is up 0.30% at the end of the North American session, driven by expectations of a US interest rate hike in June.
- Despite a neutral to the downside bias, the recent correction has investors bullish on breaking through several resistance levels, including the crucial 0.9000 level.
- Mixed signals from oscillators suggest caution for USD/CHF buyers.
He USD/CHF It advanced late in the North American session as the dollar held firm on expectations that the US central bank would hike rates in June. On the other hand, the market mood was clouded by uncertainty about the testimony of the US Federal Reserve (Fed) Chairman, Jerome Powell, in the US Congress. As of this writing, USD/CHF is trading at 0.8980, up 0.30%.
USD/CHF Price Analysis: Technical Perspective
From a technical point of view, the USD/CHF presents a neutral to bearish bias. However, the recent correction keeps buyers hoping to shift the pair’s bias to neutral if several resistance levels are breached. First, USD/CHF should recover to 0.9000, followed by a conquest of the 20-day EMA at 0.9007. In that case, the next bid zone would be the June 15 daily high at 0.9056, followed by the confluence of the 20-day moving averages.
Conversely, and the path of least resistance, the first support for USD/CHF would be the June 16 low at 0.8940. Once broken, the pair could head towards the 0.8900 zone, before challenging the year-to-date low of 0.8819.
Oscillators are offering mixed signals, with the RSI, albeit in bearish territory, pointing north; while the three-day exchange rate (RoC) portrays the pair
USD/CHF Price Action – Daily Chart
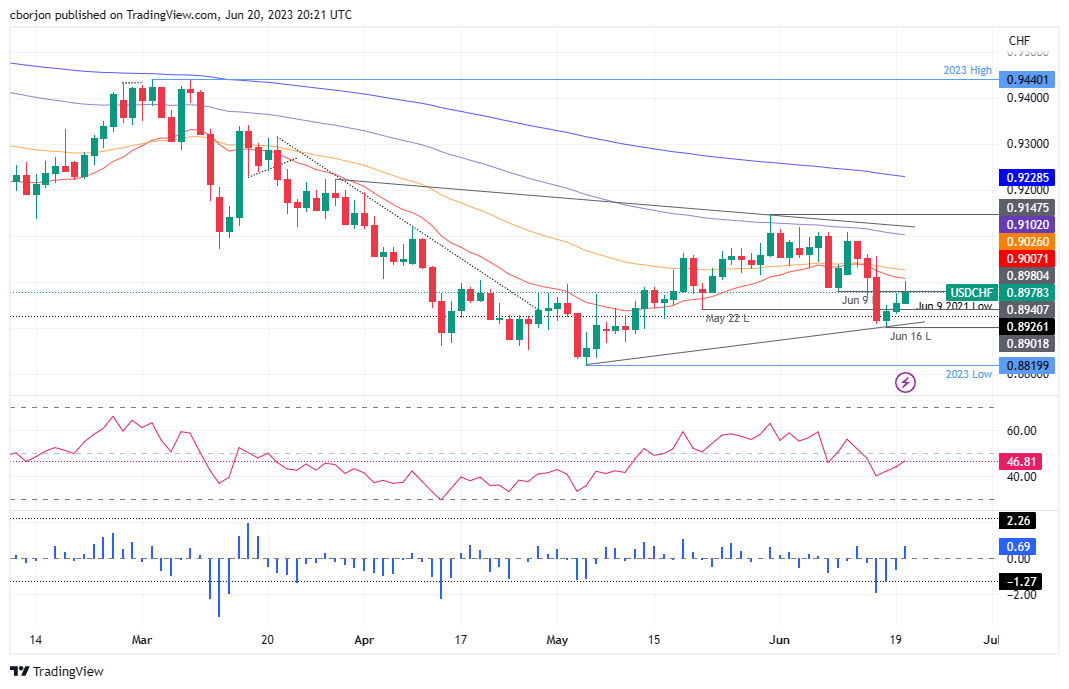
Source: Fx Street
I am Joshua Winder, a senior-level journalist and editor at World Stock Market. I specialize in covering news related to the stock market and economic trends. With more than 8 years of experience in this field, I have become an expert in financial reporting.


