
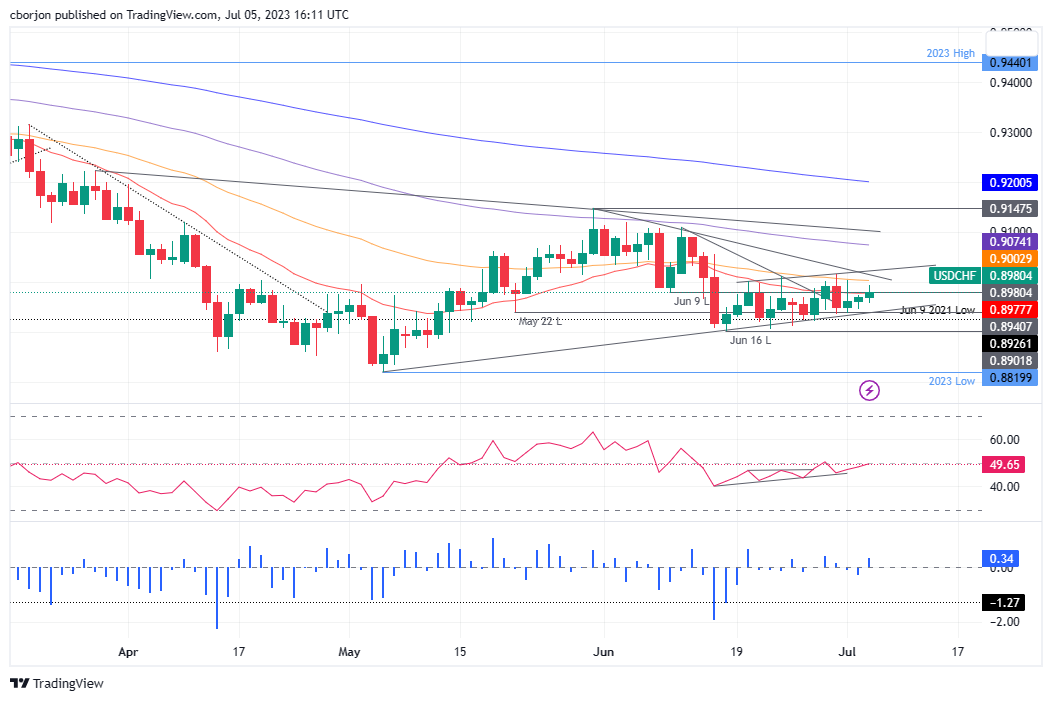
- The USD/CHF pair is trading at the 0.8934/0.9004 zone, showing a neutral bias to the downside amid a lack of strong catalysts.
- The RSI points to an uptrend, while the RoC indicates that buyers remain in control, sending mixed signals to traders.
- A break above 0.9000 could challenge current resistance levels, while a drop below 0.8945 could trigger a deeper drop.
The pair USD/CHF The US rallied steadily during trading on Wednesday, following the release of economic data from the United States, which gave a grim economic outlook, as traders prepare for the release of the latest Fed policy minutes. USD/CHF is trading at 0.8977 after hitting a daily low of 0.8957 and gains 0.08%.
USD/CHF Price Analysis: Technical Perspective
USD/CHF maintains a neutral bias to the downside, but the lack of catalyst led to consolidation during the week at the 0.8934/0.9004 zone. However, the long-term daily EMAs above the current exchange rate justify further declines.
Although the Relative Strength Index (RSI) is in bearish territory, it continues to rise, it is about to cross above the mid-50 line and will turn bullish, while the three-day rate of change (RoC) suggests that buyers continued to rule.
Therefore, the mixed signals could refrain traders from placing new long/short bets on the pair. However, if USD/CHF recovers to 0.9000, the pair could challenge the confluence of the 50-day EMA and the current week’s high around 0.9003/04. A break of this latter level would uncover the June 30 USD/CHF high at 0.9016, followed by a month-old downside resistance trend line at 0.9015, followed by the 100-day EMA at 0.9074. , and 0.9100.
On the flip side, if USD/CHF falls below the July 4 daily low at 0.8945, which, once broken, will expose the June 30 daily low at 0.8935, before dipping towards the June 16 low. at 0.8901.
USD/CHF Price Action – Daily Chart
Source: Fx Street
I am Joshua Winder, a senior-level journalist and editor at World Stock Market. I specialize in covering news related to the stock market and economic trends. With more than 8 years of experience in this field, I have become an expert in financial reporting.


