
- USD/CHF records losses of 1.68% as the weekend approaches.
- Risk appetite market mood capped USD/CHF decline as safe-haven appetite ebbed.
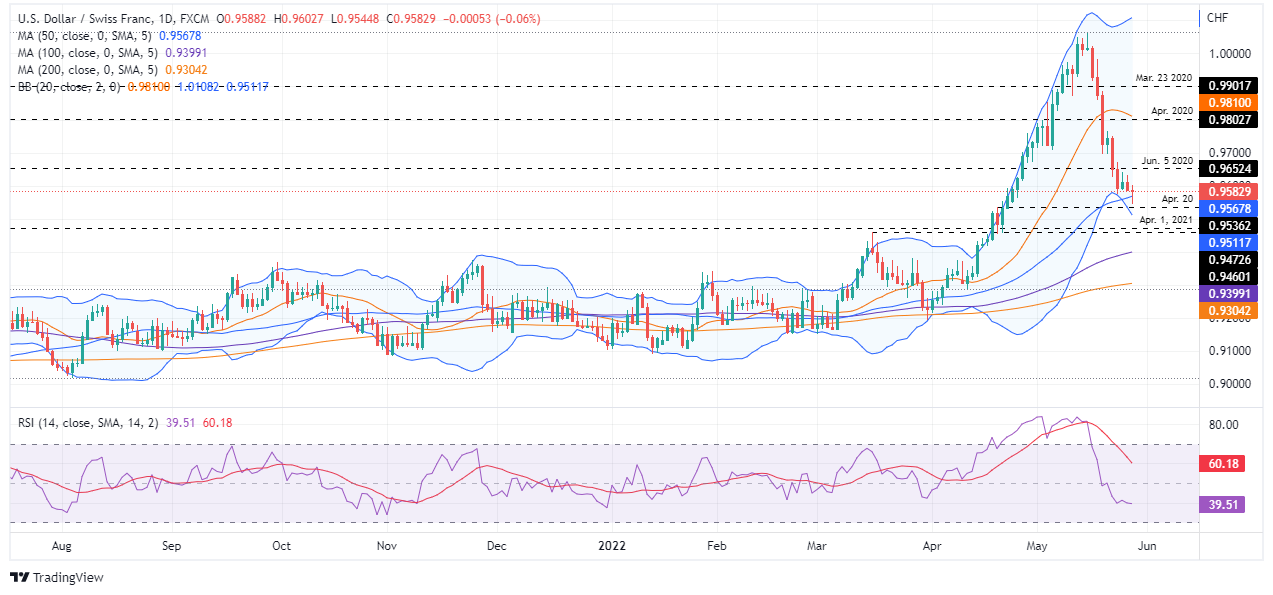
- USD/CHF Price Forecast: For the bulls to regain control, a daily close above 0.9600 is necessary.
The Swiss franc will end for the second week in a row with strong gains, as evidenced by the USD/CHF lose 1.68%. In the American session on Friday, USD/CHF was down 0.07%, trading at 0.9583 at the time of writing.
Sentiment remains upbeat, as the Fed’s favorite inflation measure, while approaching 40-year highs, eased from the 5% threshold to 4.9% y/y. US equities are rising for the day. Even the S&P 500 has almost trimmed its monthly gains in what appears to be a relief rally as investors backed away from an “aggressive” Fed tightening cycle.
Meanwhile, the US Dollar Index, a gauge of the value of the USD, after minimal gains of 0.05%, stands at 101.812. By contrast, US Treasury yields remain flat, led by 10-year yields, stationary at 2,749%.
USD/CHF Price Forecast: Technical Outlook
Friday’s price action pushed USD/CHF towards fresh five-week lows near 0.9545, but bounced below the 50-day moving average (DMA) around 0.9567 as USD/CHF bulls brace to launch an assault towards 0.9600, in order to keep the uptrend intact. However, to their detriment, the oscillators remain in bearish territory through lack of direction, opening the door for a consolidation.
To the upside, the first resistance of the USD/CHF would be 0.9600. The break above would open the door to other supply zones. First up is the May 26 daily high at 0.9632, followed by the June 5 high at 0.9652. On the other hand, the first support for the USD/CHF would be the 50 DMA at 0.9567. A break of the latter would expose the lower Bollinger Band at 0.9511, followed by a retest of the 0.9500 figure.
Technical levels
Source: Fx Street
With 6 years of experience, I bring to the table captivating and informative writing in the world news category. My expertise covers a range of industries, including tourism, technology, forex and stocks. From brief social media posts to in-depth articles, I am dedicated to creating compelling content for various platforms.


