
- USD/CHF rises steadily, buoyed by US economic data and speculation of further Fed tightening.
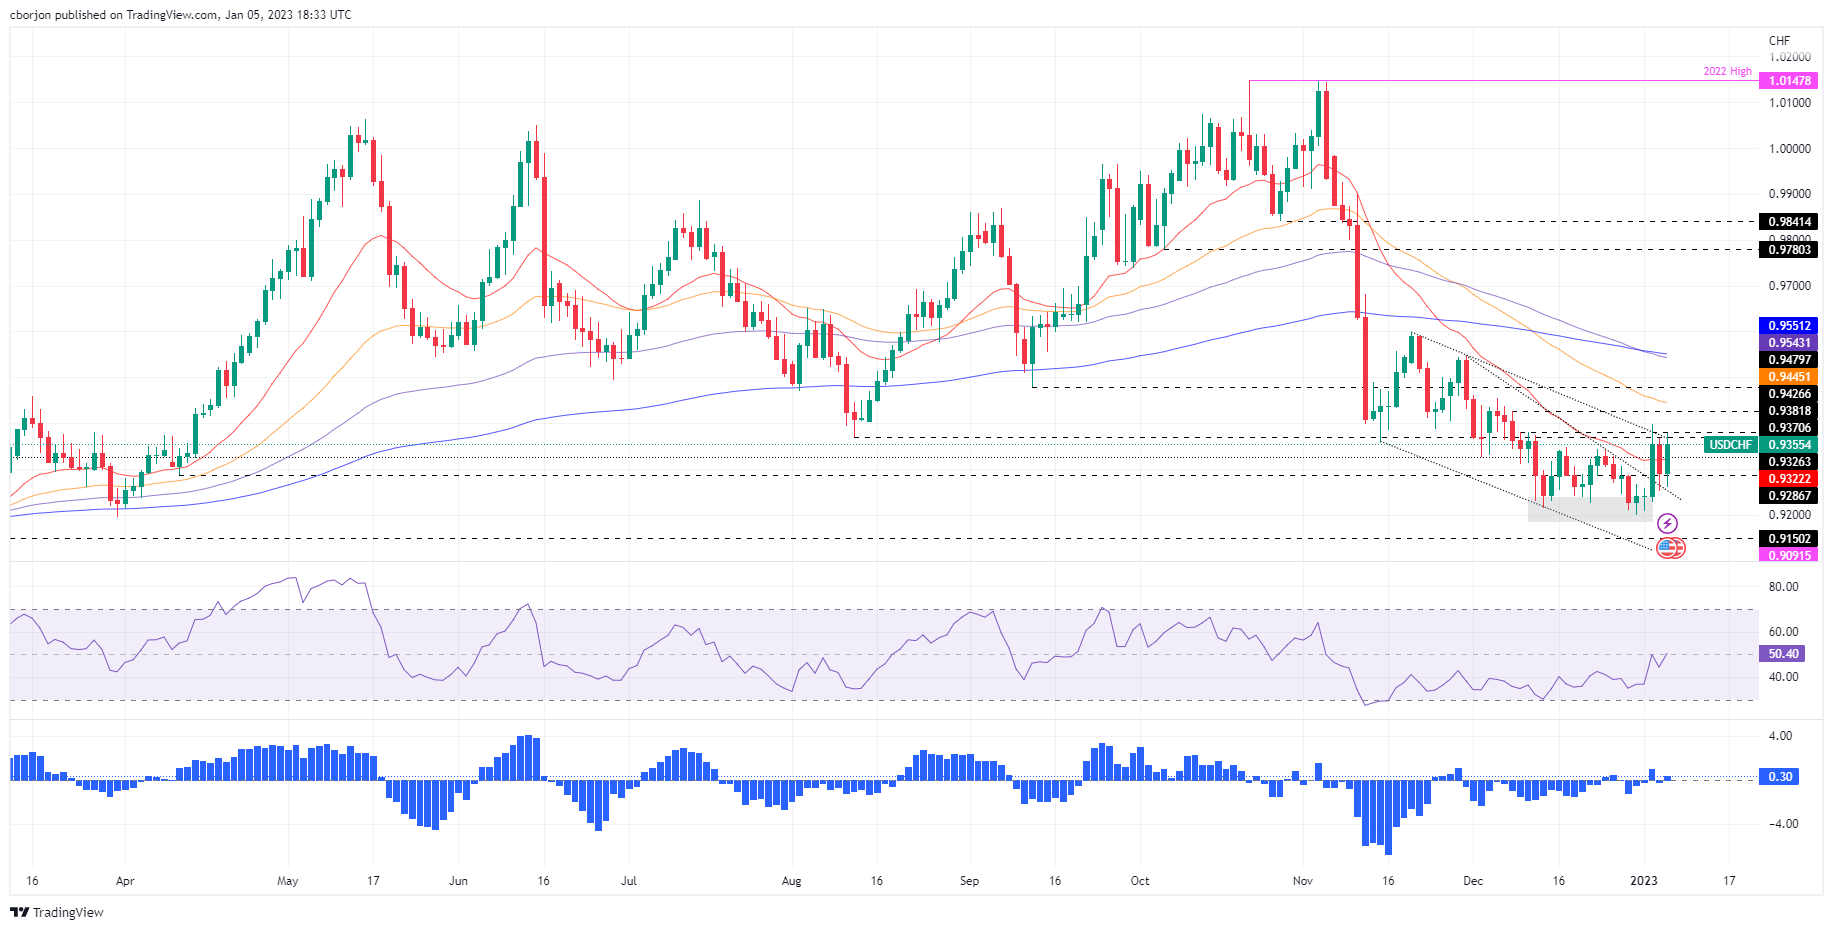
- The USD/CHF pair bounced around the upper trend line of a falling wedge that became support around 0.9250.
- A daily close above 0.9366 could lead USD/CHF to rally towards 0.9400 and beyond.
The USD/CHF It erases Wednesday’s losses and rises over 70 points on Thursday, clearing its way towards solid resistance levels such as the 20-day EMA at 0.9322. Factors such as the release of strong labor market data in the United States (US) lifted USD/CHF from daily lows at 0.9260. At the time of writing these lines, USD/CHF is trading at 0.9360.
USD/CHF Price Analysis: Technical Perspective
After finding support around 0.9200, USD/CHF resumed its uptrend, with sights set on breaking above Wednesday’s daily high at 0.9366. USD/CHF fell towards the upper trend line of a falling wedge, previously broken during the week, which turned into support. Therefore, the pair bounced around 0.9250 and headed towards a downtrend resistance line that passed around 0.9370.
If USD/CHF achieves a daily close above 0.9366, it could open the door for further gains, implying a test of the 0.9400 signal, which, once broken, would send USD/CHF towards the 100-day EMA. at 0.9445, followed by a test of 0.9500.
As an alternative scenario, the first support for USD/CHF would be the 20-day EMA at 0.9322, followed by 0.9300 and the upper trend line of a falling wedge residing around 0.9250.
Key technical levels for USD/CHF
Source: Fx Street
I am Joshua Winder, a senior-level journalist and editor at World Stock Market. I specialize in covering news related to the stock market and economic trends. With more than 8 years of experience in this field, I have become an expert in financial reporting.


