
- USD/CHF is posting 1.33% gains for the week.
- The fragile market sentiment keeps investors flowing in and out of safe-haven pairs such as the US dollar.
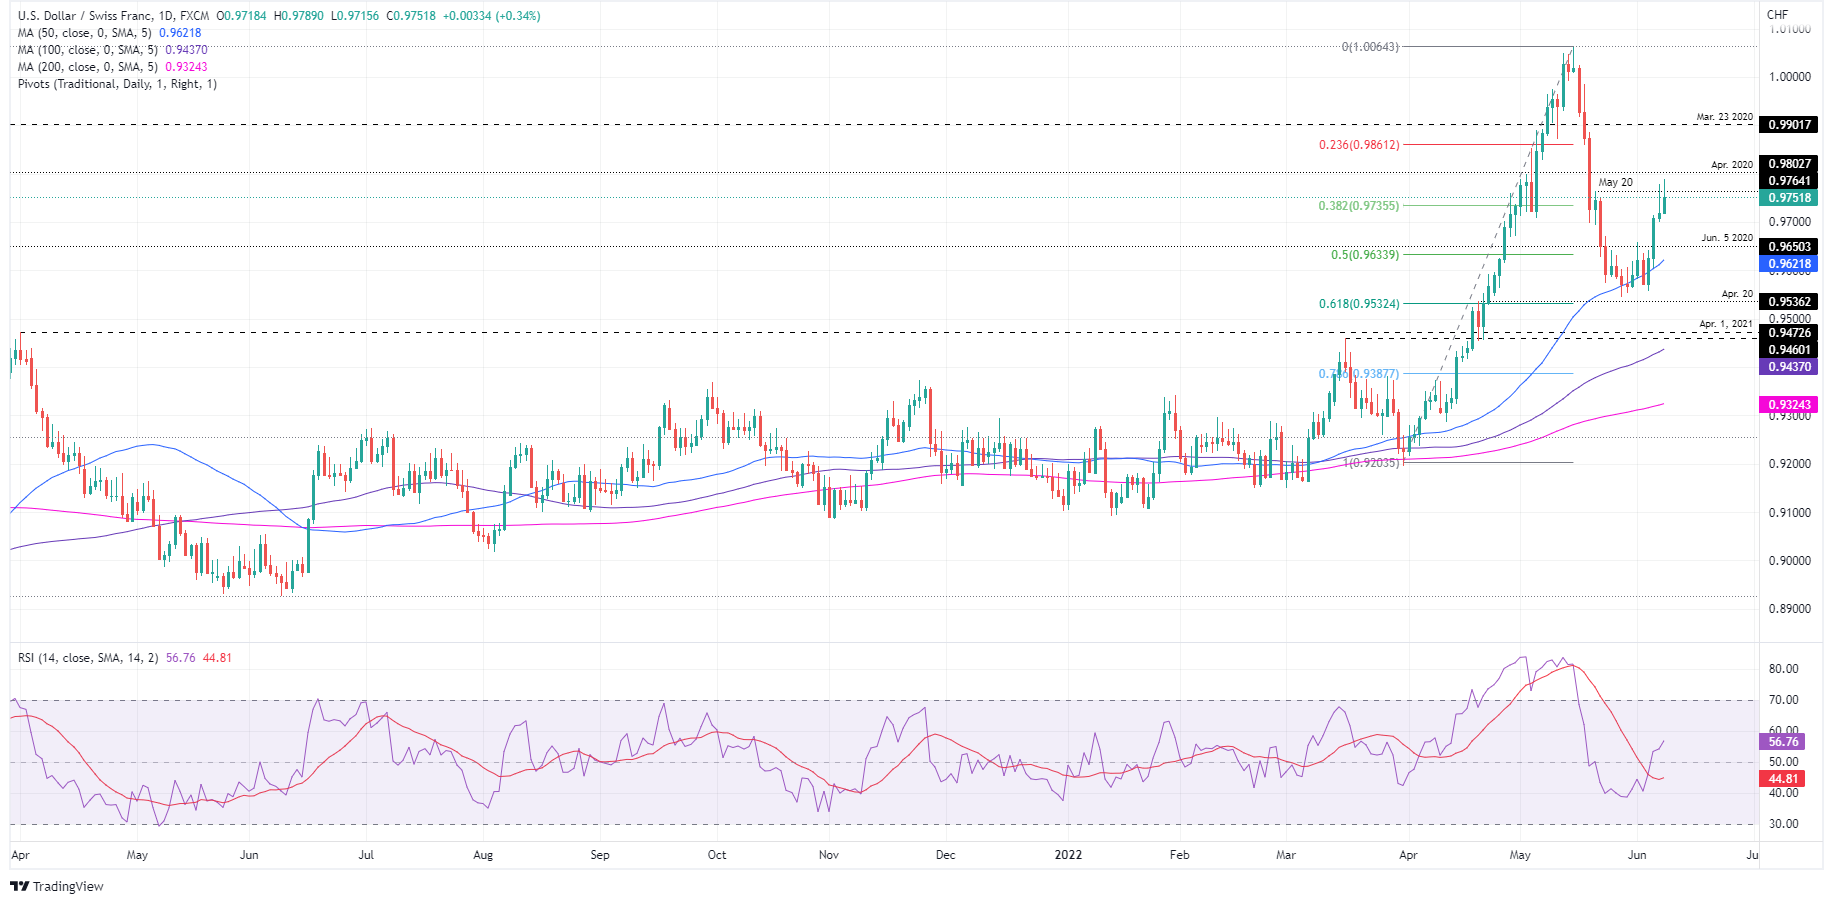
- USD/CHF Price Forecast: In a 30 pip range, around the 0.9735-65 zone.
The USD/CHF rises for the fourth day in a row but pulls back from weekly highs around 0.9780, though still up 0.30%. At the time of writing, the USD/CHF is trading at 0.9751.
Factors like the bad mood of the markets drive the appetite for the USD. Reflecting this are European and US stocks, which fall except for the Nasdaq 100, undermined by rising global bond yields. The 10-year US Treasury yield rises three and a half points above 3,014%.
The dollar index, which measures the behavior of the dollar against a basket of six currencies, remains sideways during the day at 102.336.
USD/CHF Price Forecast: Technical Outlook
USD/CHF remains in a bullish bias after the 500 pip retracement from the year high at 1.0007, which bounced below the 61.8% retracement of the Fibonacci level at 0.9532. However, in recent days, USD/CHF traders, unable to break above the May 20 high of 0.9764, would keep USD/CHF in a tight 30 pip range, with the 38.2% Fibonacci level retracement at 0.9735 at the bottom of the range bottom, and 0.9764 at the top of the range.
To the upside, the first resistance for USD/CHF would be 0.9764, the top of the range. A break above would expose the major to more upside pressure and send it towards the 23.6% Fibonacci retracement at 0.9861. Once surpassed, the test of the maximum of the last years in 1.0007 is foreseen. Otherwise, the first support for USD/CHF would be the psychological figure at 0.9700. If the latter is broken, the 50% Fibonacci retracement at 0.9633, followed by the 50-day moving average (DMA) at 0.9621.
Technical levels
Source: Fx Street
With 6 years of experience, I bring to the table captivating and informative writing in the world news category. My expertise covers a range of industries, including tourism, technology, forex and stocks. From brief social media posts to in-depth articles, I am dedicated to creating compelling content for various platforms.


")

