
- USD/CHF bulls crashed through the 20 day EMA and then jumped ship as bears intervened.
- The pair is heading towards the psychological zone of 0.9100, which, once broken, could put last year’s low into play.
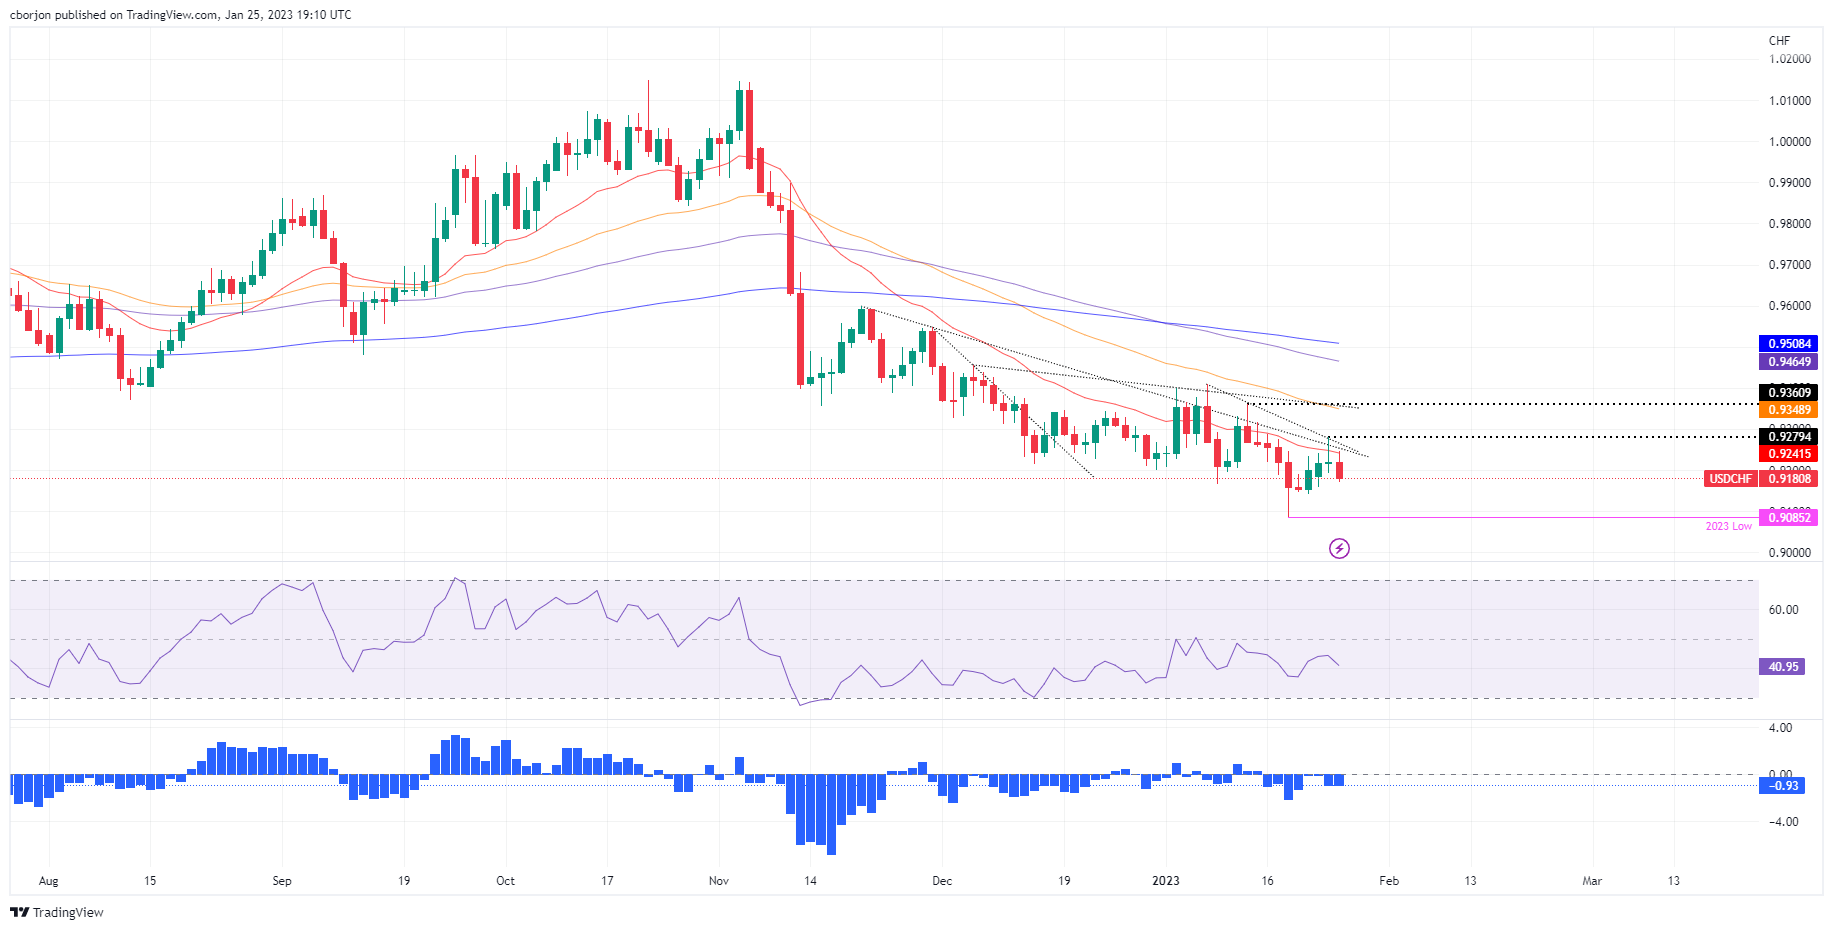
- USD/CHF: Failure to post a new yearly low could exacerbate a bullish correction.
The USD/CHF struggles to break above the 20 day EMA and turns below 0.9200 to fresh two-day lows at 0.9172 as the US dollar continues to be offered in the currency space. In addition, a risk aversion momentum underpins the safe haven status of the Swiss franc (CHF). Therefore, USD/CHF is trading at 0.9182 after reaching a daily high of 0.9245.
USD/CHF Price Analysis: Technical Perspective
USD/CHF continued its downtrend after hitting a weekly high at 0.9297, unable to recover 0.9300, compounding the decline below the 20-day EMA at 0.9241. Furthermore, it opened the way for the USD/CHF pair to test the year-to-date (YTD) lows at 0.9085, although initially, it would have to break through intermediate demand zones.
On its way to the year-to-date lows, the first support level for USD/CHF would be this week’s low of 0.9159. A break below would uncover the Jan 20 daily low at 0.9141, ahead of the 0.9100 signal. Once the psychological price level subsides, then the yearly low would be in play.
As an alternative scenario, the first resistance for USD/CHF would be the 0.9200 area. Once broken, USD/CHF could test the 20-day EMA at 0.9241, followed by a two-month downtrend line around 0.9250/60.
Looking ahead, the failure of USD/CHF to test the previous year’s low could expose the pair to some buying pressure as the pair has been bottoming around 0.9085/0.9160 since December 2022.
Key technical levels for USD/CHF
Source: Fx Street
I am Joshua Winder, a senior-level journalist and editor at World Stock Market. I specialize in covering news related to the stock market and economic trends. With more than 8 years of experience in this field, I have become an expert in financial reporting.


