
- USD/CHF will end the week with solid losses of 1.30%.
- Market sentiment remains negative, a headwind for USD/CHF.
- USD/CHF Price Analysis: A break below 0.9600 would open the door towards 0.9510.
The USD/CHF falls on worse-than-expected US PMI data, further extending its weekly losses as sentiment deteriorates due to the aforementioned and earnings reports from US tech companies. Investors sought safe havens and peers, bolstering the Swiss franc. At the time of writing, USD/CHF is trading at 0.9631, down 0.34%.
US stocks fell across the board, while the USD fell 0.11%, as the dollar index shows at 106.483. US bonds jump, fueling a slide in US Treasury yields, led by the 10-year yield down ten basis points to 2,776%.
USD/CHF Price Analysis: Technical Outlook
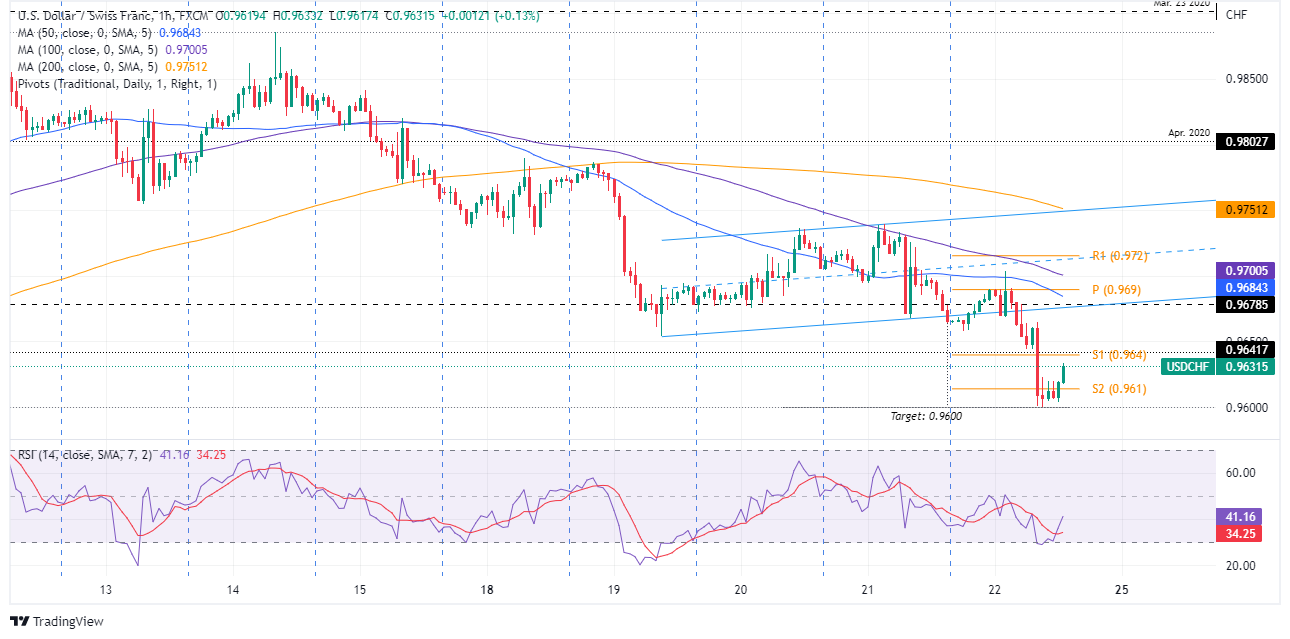
USD/CHF started trading around the 0.9660 area and rallied towards the daily high of 0.9700. However, buyers had a hard time breaking through the resistance, with USD/CHF dipping to a daily low of 0.9599 before settling at the current exchange rate.
USD/CHF 1 hour chart
“A breakout of the latter (0.9675) will immediately expose the lower trend line of the aforementioned ascending channel, meaning the next target for USD/CHF would be 0.9600.” This happened on Friday, and the pair entered a range as the Relative Strength Index (RSI) jumped off oversold readings, approaching the 50 midline.
However, the USD/CHF bias remains bearish, but an extension of the upside is anticipated, and USD/CHF could reach the S1 daily pivot at 0.9640 before resuming the downtrend. Therefore, the first USD/CHF support would be the S2 daily pivot at 0.9614. A break below exposes the 0.9600 figure, followed by the S3 pivot at 0.9560 and the S4 daily pivot at 0.9514.
Technical levels
Source: Fx Street
With 6 years of experience, I bring to the table captivating and informative writing in the world news category. My expertise covers a range of industries, including tourism, technology, forex and stocks. From brief social media posts to in-depth articles, I am dedicated to creating compelling content for various platforms.


