
- USD/CHF hovers near a six-month high around 0.9150, showing strength ahead of crucial US data.
- The SNB is expected to extend the rate cut cycle in June.
- The Fed considers the current interest rate policy framework adequate.
The USD/CHF pair hovers around the six-month high of 0.9150 in the American session on Wednesday. The short-term outlook for the Swiss franc asset remains bullish, with expectations of further escalation of the policy divergence between the Federal Reserve (Fed) and the Swiss National Bank (SNB).
The Fed is expected to keep interest rates at their current levels for longer, given the strength of the US labor market and the persistent rise in inflation due to strong consumer spending.
The SNB will reduce interest rates again at the June monetary policy meeting. The SNB kicked off the global cycle of rate cuts after reducing borrowing rates by 25 basis points (bp), to 1.5%, at its March meeting. Inflation in the Swiss economy has softened below the 2% target for the longest time, allowing the SNB to cut official interest rates further.
Meanwhile, investors await crucial US first-quarter Gross Domestic Product (GDP) data and March underlying personal consumption expenditure (PCE) price index, due out on Thursday and Friday. The economic data will influence market expectations for the Fed's rate cuts, which are currently expected at the September meeting.
USD/CHF is trading in a tight range near the crucial resistance of 0.9110, which is drawn from the November 1, 2023 high on a daily time frame. The pair is expected to extend its uptrend as the upward-sloping 20-day EMA near 0.9075 suggests a near-term bullish outlook.
The 14-period RSI is oscillating in the bullish range of 60.00-80.00, indicating that the bullish momentum is still active.
Looking ahead, a bullish move above the intraday high of 0.9153 will push the pair towards the round level support of 0.9200. Breaking this last level would push the asset towards the October 4, 2023 high at 0.9232.
In an alternative scenario, further declines would occur if the pair breaks the psychological support of 0.9000, which would expose it to the March 22 low at 0.8966, followed by the March 1 high at 0.8893.
USD/CHF Daily Chart
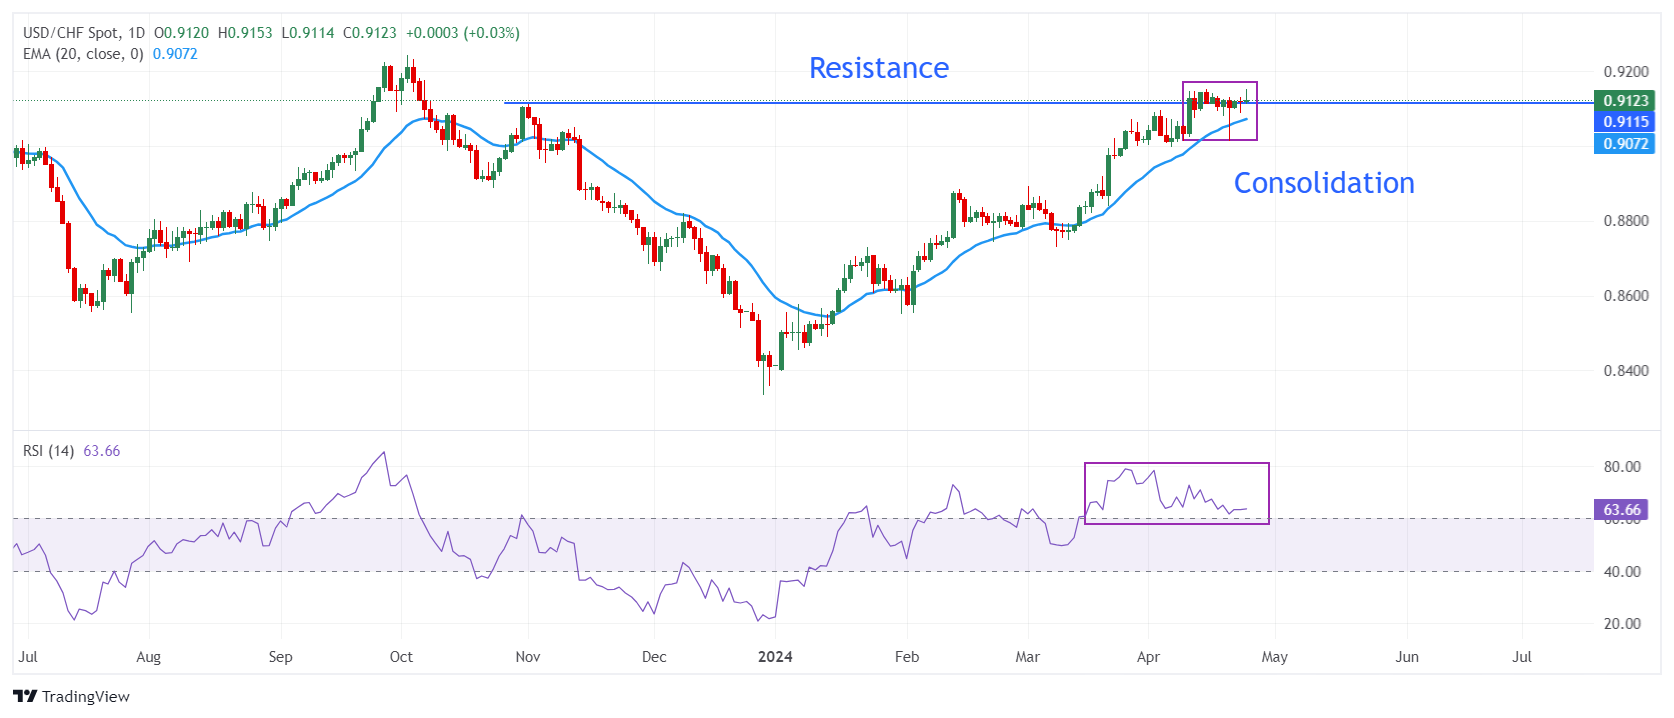
Source: Fx Street
I am Joshua Winder, a senior-level journalist and editor at World Stock Market. I specialize in covering news related to the stock market and economic trends. With more than 8 years of experience in this field, I have become an expert in financial reporting.


