
- USD/CHF changes hands below its opening price, despite recovering from daily lows.
- USD/CHF is range bound as a break of the range top will pave the way above the 0.9700 figure; otherwise, a drop to 0.9550 is anticipated.
The USD/CHF falls into negative territory after refreshing five-week highs around 0.9650, courtesy of broad US dollar weakness across the board, amid an upbeat market environment. After reaching a daily high at 0.9626, the USD/CHF dipped below the 50-day EMA at 0.9612, the daily low, before jumping to current price levels. At the time of writing, USD/CHF is trading at 0.9645, below its opening price.
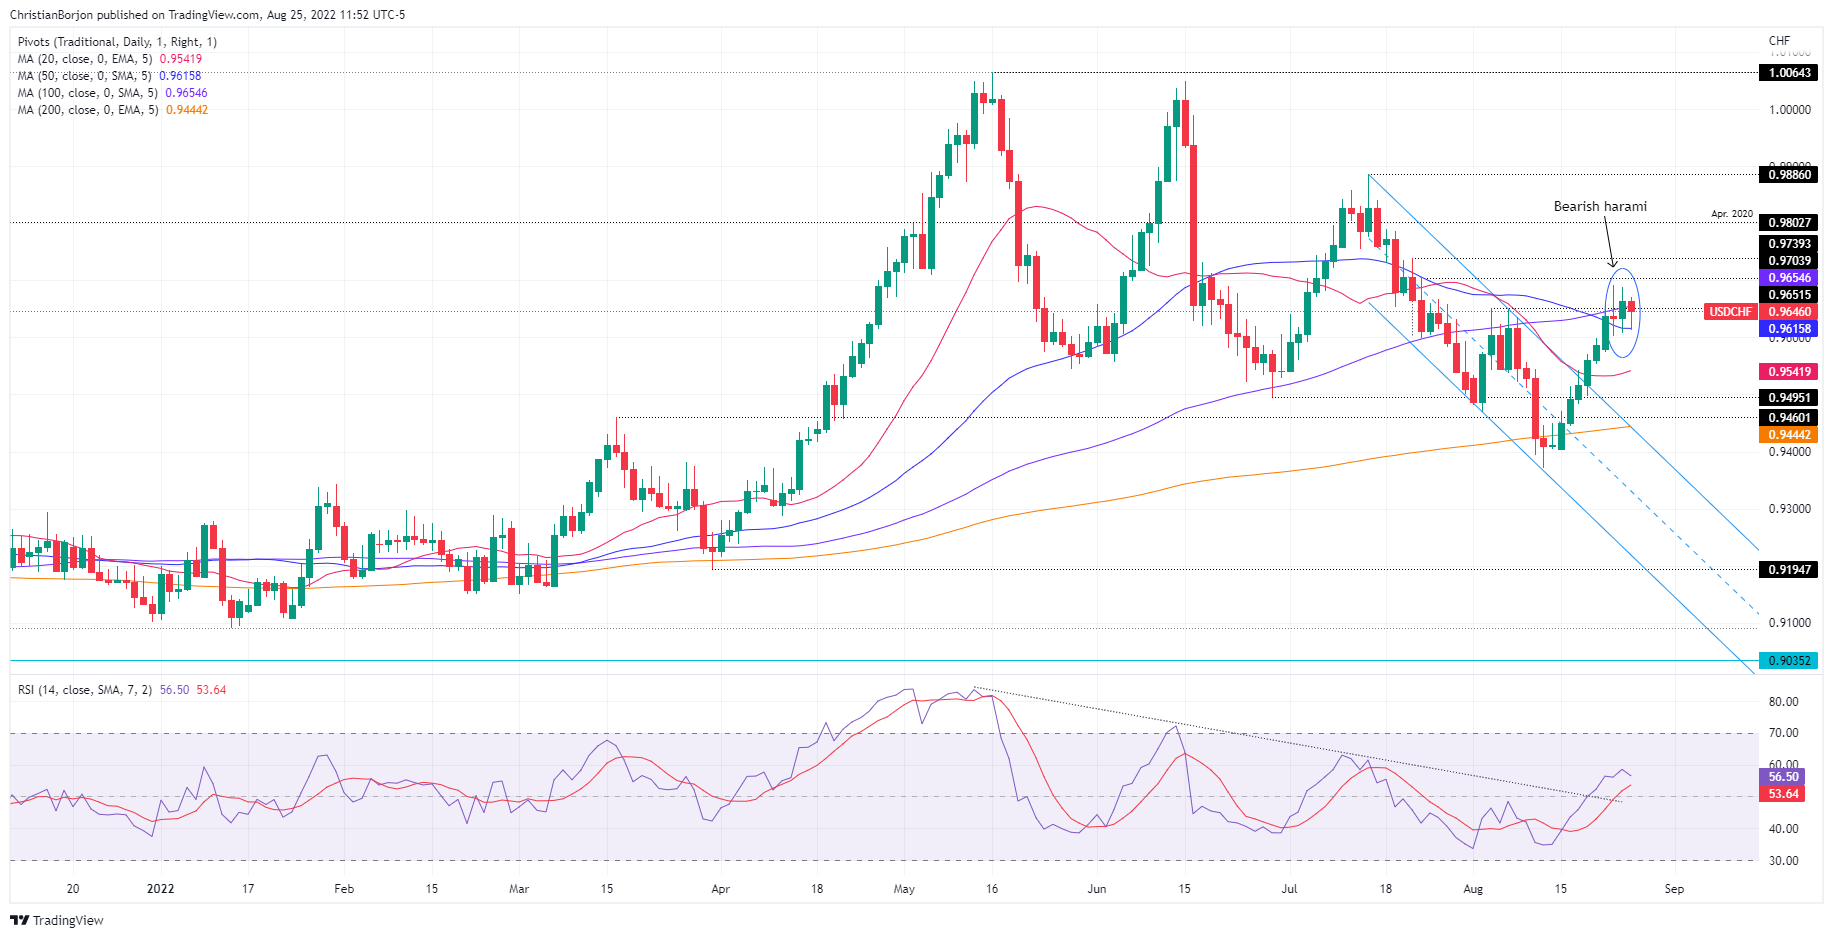
USD/CHF Price Analysis: Technical Outlook
A bearish candlestick chart pattern is visible on the USD/CHF daily chart. Although the pattern has bearish implications, the oscillators and moving averages (MAs) show otherwise. Although the RSI is sloping downward, it remains in positive territory. Meanwhile, all the daily exponential moving averages are below the USD/CHF spot price, which suggests that the buyers are in command.
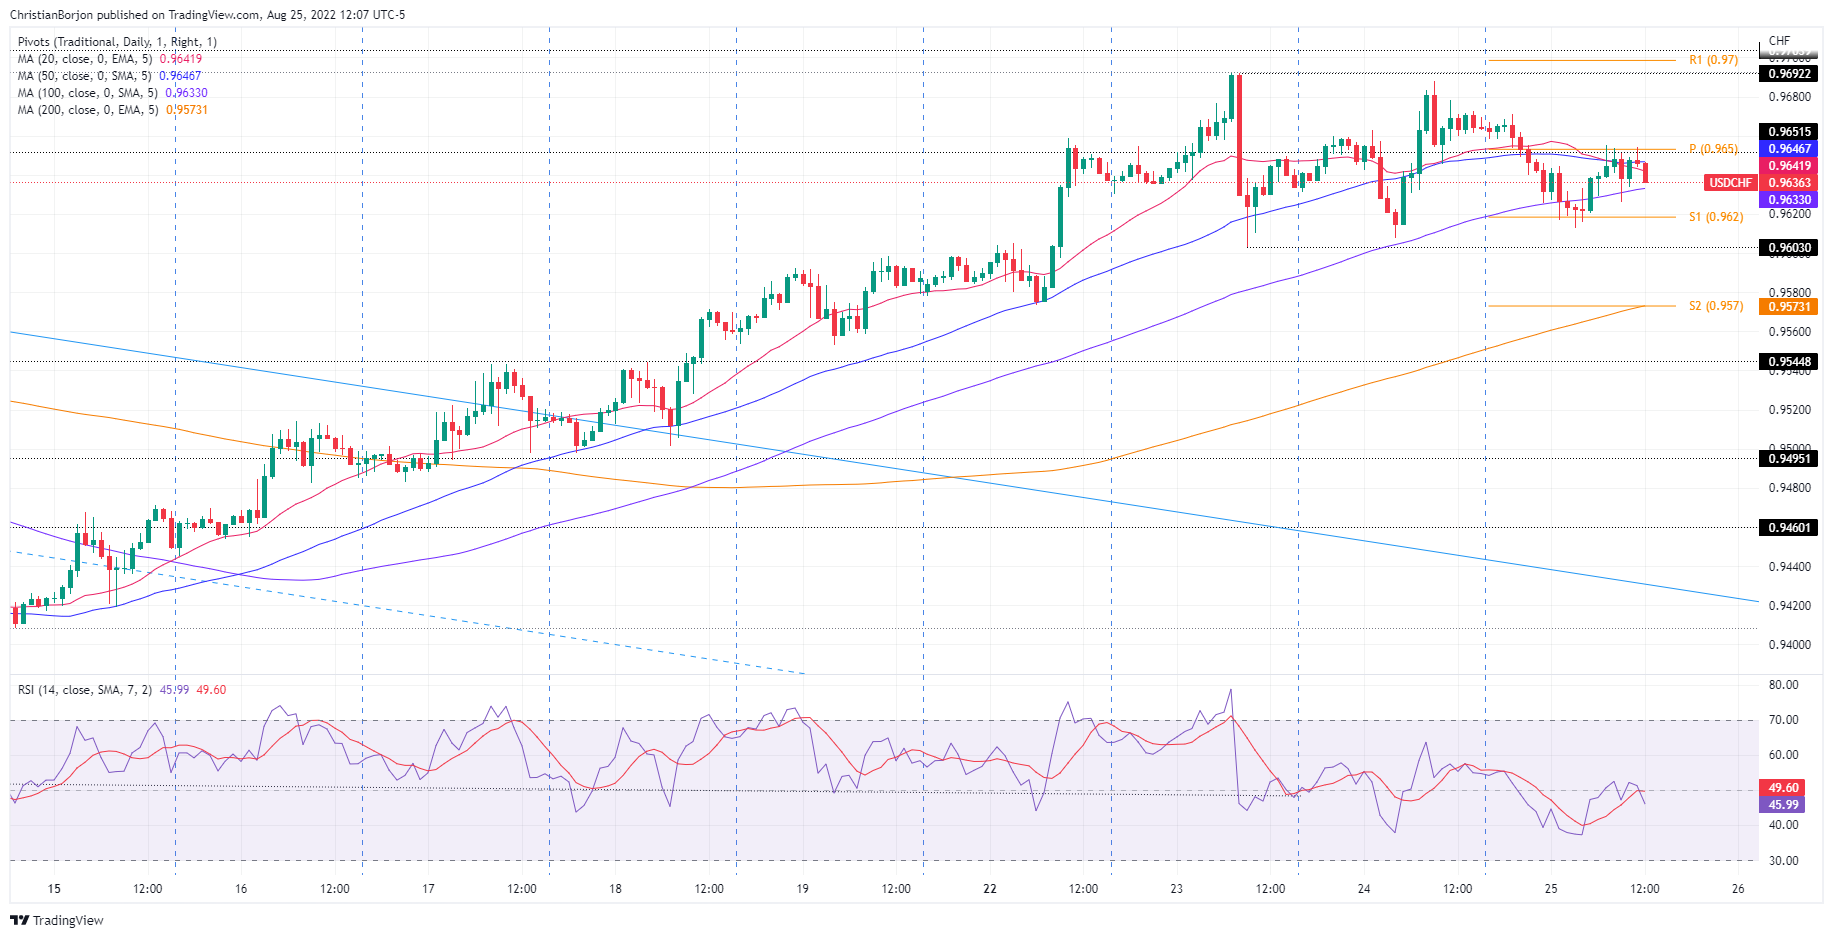
In the short term, the USD/CHF one hour chart shows that the pair has been range bound within the 0.9603-0.9692 zone for the past three days. One more confirmation of the above is that the 20, 50 and 100 EMAs are in the 0.9632-46 zone. Also, the Relative Strength Index (RSI) at 52 is almost flat.
Therefore, if USD/CHF breaks out of the range, the first resistance would be 0.9700. Once broken, the next resistance would be the R2 daily pivot at 0.9733, followed by 0.9800. On the other hand, the first support for the USD/CHF would be 0.9600, followed by the confluence of the 200 EMA and the S2 pivot at 0.9570, and then the daily low of 19 Aug at 0.9553.
Technical levels
Source: Fx Street
With 6 years of experience, I bring to the table captivating and informative writing in the world news category. My expertise covers a range of industries, including tourism, technology, forex and stocks. From brief social media posts to in-depth articles, I am dedicated to creating compelling content for various platforms.


