
- Prices paid by US producers show signs of relaxation, except for the core PPI.
- Core inflation in the US is showing signs of being firmer than estimated.
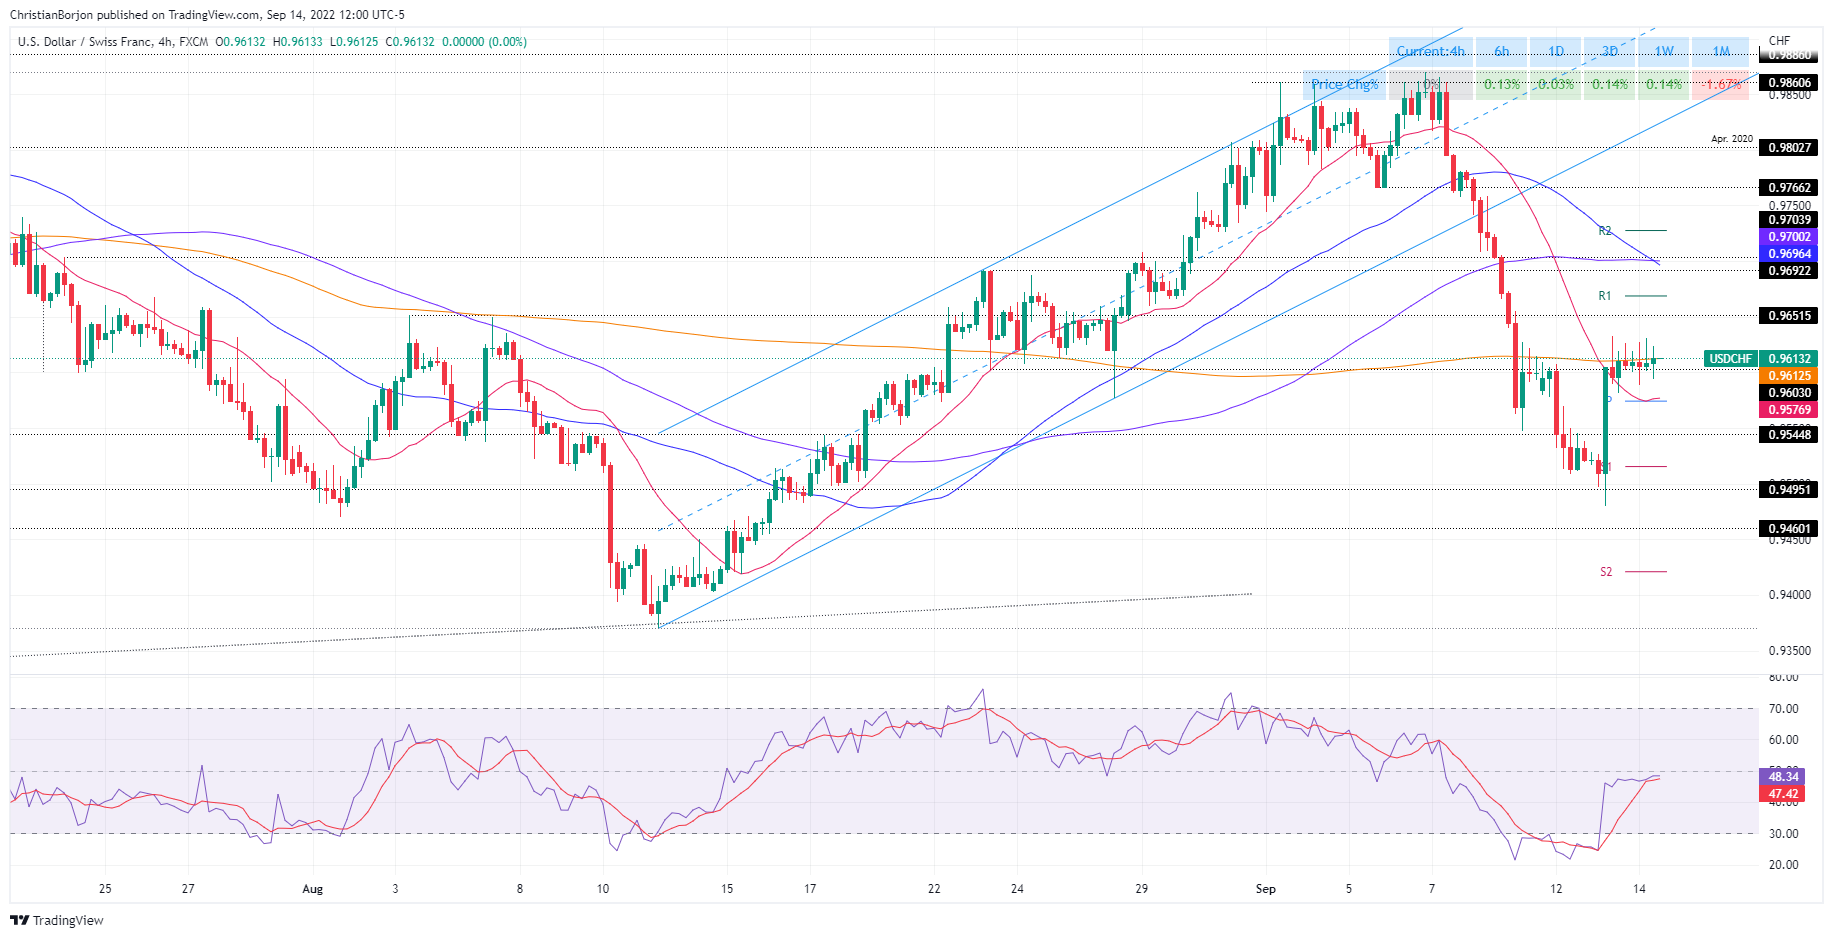
- USD/CHF Price Analysis: Break Above 0.9630 Puts 0.9700 Level In Play; otherwise, a drop to 0.9420 is anticipated.
The USD/CHF is trading sideways after rising 0.82% on Tuesday in reaction to US inflation data showing signs of easing in the simple CPI. However, core inflation is rising on the consumer and producer side, as reported by the US Department of Labor. Therefore, USD/CHF was almost unchanged, but down slightly by 0.01%, trading at 0.9613.
USD/CHF Price Analysis: Technical Outlook
The USD/CHF daily chart on Wednesday shows the pair with a neutral bias to the downside, and it is worth noting that the major previously tested the weekly high around 0.9633, but broad US dollar weakness capped the rally. of USD/CHF prices.
Meanwhile, the USD/CHF four-hour scale shows that the pair is consolidating above the 20 EMA and the daily pivot point, each at 0.9576 and 0.9574, respectively. Furthermore, the 200 EMA at 0.9612 is acting as resistance, keeping USD/CHF prices subdued and unable to break the daily high at 0.9630.
A clear break above the 200 EMA would open the door for a test of Wednesday’s high at 0.9630, which once broken, the major could rally to the R1 pivot point at 0.9668. A break above would expose the confluence of the 50 and 100 EMAs at 0.9700.
On the other hand, the first support for the USD/CHF would be the confluence of the 20 EMA and the central pivot at 0.9574-76. A break of the latter would expose the S1 pivot at 0.9515, followed by the 13 Sep low at 0.9479, followed by the S2 pivot point at 0.9421.
Technical levels
Source: Fx Street
With 6 years of experience, I bring to the table captivating and informative writing in the world news category. My expertise covers a range of industries, including tourism, technology, forex and stocks. From brief social media posts to in-depth articles, I am dedicated to creating compelling content for various platforms.


