- USD/CHF retreats 0.20%, testing support levels after US jobs data fuels expectations of aggressive rate cuts by the Fed.
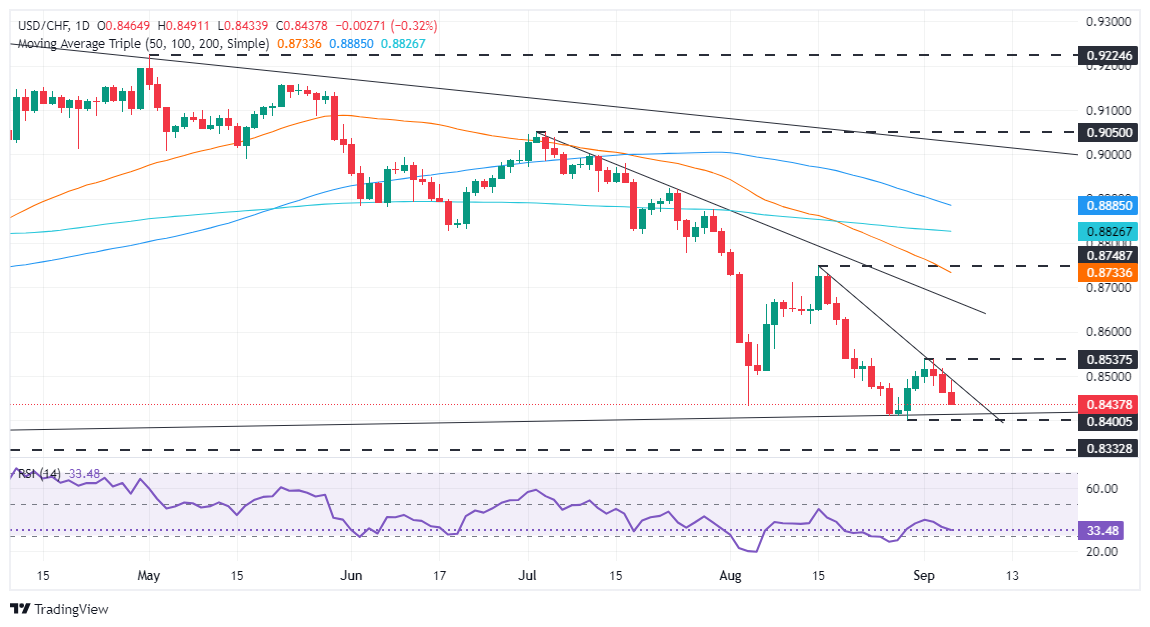
- The pair is targeting a retest of the year-to-date low of 0.8400, with further downside targets at 0.8332 and 0.8300.
- For a bullish recovery, USD/CHF needs to break above the August 15 high at 0.8748.
The USD/CHF retreated at the end of the New York session, down 0.20%, as US employment data revealed that the labor market is cooling, which could justify “aggressive” rate cuts by the Federal Reserve (Fed). At the time of writing, the pair is trading at 0.8447 after hitting a daily high of 0.8490.
USD/CHF Price Forecast: Technical Outlook
The failure of the USD/CHF to break above the key resistance trend line around 0.8530-50 sponsored a decline in the pair. On its way to the current exchange rate, the pair surpassed the 0.8500 figure, tested today.
Momentum is favouring sellers, as shown by the Relative Strength Index (RSI). This could help refresh the year-to-date (YTD) low of 0.8400, reached on August 29.
If USD/CHF breaks above 0.8400, the next support would be last year’s low of 0.8332 before challenging 0.8300.
The USD/CHF pair needs to overcome the August 15 high at 0.8748 for a bullish recovery.
USD/CHF Price Action – Daily Chart
Swiss Franc PRICE Today
The table below shows the exchange rate of the Swiss Franc (CHF) against major currencies today. The Swiss Franc was the strongest currency against the US Dollar.
| USD | EUR | GBP | JPY | CAD | AUD | NZD | CHF | |
|---|---|---|---|---|---|---|---|---|
| USD | -0.25% | -0.23% | -0.24% | -0.02% | -0.22% | -0.41% | -0.32% | |
| EUR | 0.25% | 0.03% | 0.02% | 0.27% | 0.04% | -0.11% | -0.07% | |
| GBP | 0.23% | -0.03% | -0.02% | 0.23% | 0.00% | -0.15% | -0.10% | |
| JPY | 0.24% | -0.02% | 0.02% | 0.22% | 0.02% | -0.15% | -0.07% | |
| CAD | 0.02% | -0.27% | -0.23% | -0.22% | -0.19% | -0.36% | -0.31% | |
| AUD | 0.22% | -0.04% | -0.01% | -0.02% | 0.19% | -0.17% | -0.10% | |
| NZD | 0.41% | 0.11% | 0.15% | 0.15% | 0.36% | 0.17% | 0.06% | |
| CHF | 0.32% | 0.07% | 0.10% | 0.07% | 0.31% | 0.10% | -0.06% |
The heatmap shows percentage changes of major currencies. The base currency is selected from the left column, while the quote currency is selected from the top row. For example, if you choose Swiss Franc from the left column and move along the horizontal line to US Dollar, the percentage change shown in the chart will represent CHF (base)/USD (quote).
Source: Fx Street
I am Joshua Winder, a senior-level journalist and editor at World Stock Market. I specialize in covering news related to the stock market and economic trends. With more than 8 years of experience in this field, I have become an expert in financial reporting.


