
- USD/CHF retreats 0.18% from peak, unable to sustain gains despite positive US economic reports
- Technical analysis: resistance at 0.9135; more possible profits if exceeded.
- Support levels at 0.9098 and 0.9077; critical support at January low 0.9007.
USD/CHF retreats after reaching an eight-month peak at 0.9200 and falls towards the 0.9100 mark, recording losses of more than 0.18%. Upbeat data from the United States (US) failed to boost the Dollar, which extended its losses following dovish comments from Fed Governor Christopher Waller.
USD/CHF Price Forecast: Technical Outlook
Since October last year, the USD/CHF enjoyed a healthy bullish trend, with the Dollar appreciating more than 9% against the Swiss Franc. However, buyers failed to extend the trend as the pair fell to a six-day low on Wednesday at 0.9077 before regaining some ground.
Although the pair is set to end Thursday’s session with losses, further upside potential is seen after making a higher low, with prices finding acceptance near the 0.9098-0.9135 range.
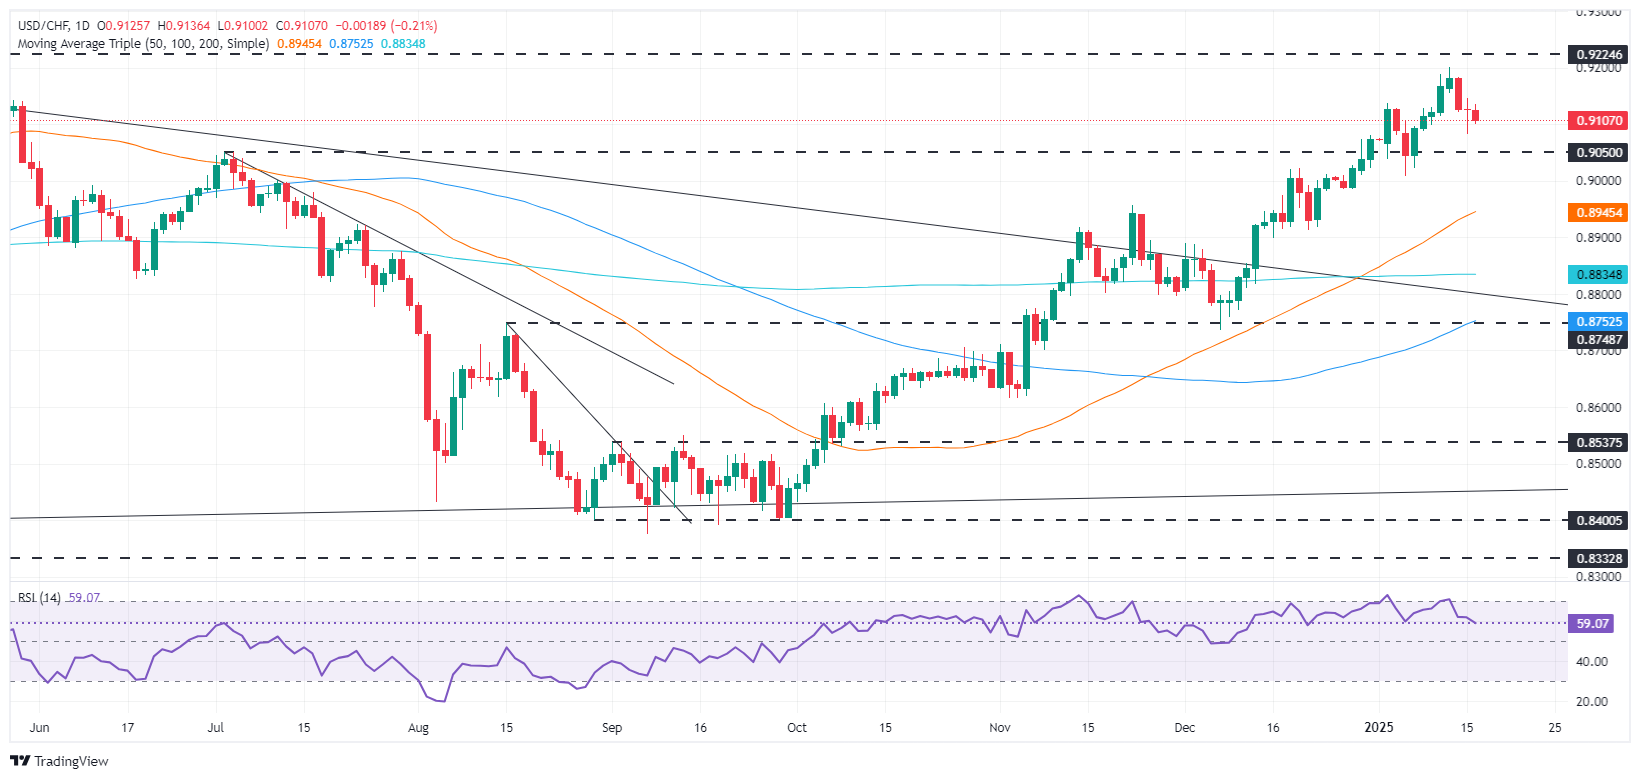
If buyers break 0.9135, the next resistance will be the Jan 13 daily high at 0.9200, the top of a ‘shooting star’. If broken, the next ceiling level will be the April 2024 peak at 0.9224.
On the contrary, if USD/CHF stays below 0.9100, the first support would be 0.9098 and 0.9077. If those levels are broken, look for a possible bounce at 0.9007, the January 6 low.
USD/CHF Price Chart – Daily
Swiss Franc PRICE Today
The table below shows the percentage change of the Swiss Franc (CHF) against major currencies today. Swiss franc was the strongest currency against the US dollar.
| USD | EUR | GBP | JPY | CAD | AUD | NZD | CHF | |
|---|---|---|---|---|---|---|---|---|
| USD | -0.03% | -0.06% | -0.05% | -0.04% | -0.04% | -0.02% | -0.05% | |
| EUR | 0.03% | -0.04% | 0.00% | -0.02% | -0.03% | 0.02% | -0.03% | |
| GBP | 0.06% | 0.04% | 0.02% | 0.03% | 0.03% | 0.05% | 0.02% | |
| JPY | 0.05% | 0.00% | -0.02% | 0.03% | 0.02% | 0.04% | 0.00% | |
| CAD | 0.04% | 0.02% | -0.03% | -0.03% | 0.00% | 0.04% | -0.01% | |
| AUD | 0.04% | 0.03% | -0.03% | -0.02% | -0.00% | 0.02% | -0.02% | |
| NZD | 0.02% | -0.02% | -0.05% | -0.04% | -0.04% | -0.02% | -0.03% | |
| CHF | 0.05% | 0.03% | -0.02% | -0.00% | 0.01% | 0.02% | 0.03% |
The heat map shows percentage changes for major currencies. The base currency is selected from the left column, while the quote currency is selected from the top row. For example, if you choose the Swiss Franc from the left column and move along the horizontal line to the US Dollar, the percentage change shown in the box will represent CHF (base)/USD (quote).
Source: Fx Street
I am Joshua Winder, a senior-level journalist and editor at World Stock Market. I specialize in covering news related to the stock market and economic trends. With more than 8 years of experience in this field, I have become an expert in financial reporting.


