
- USD/CHF has formed a bearish H&S pattern suggesting further weakness.
- Further declines will be confirmed with a break below the pattern’s base or its “neck line.”
USD/CHF has likely formed a bearish Head and Shoulders (H&S) reversal pattern on the 4-hour chart, which, if valid, indicates a likely decline for the pair.
USD/CHF 4-hour chart
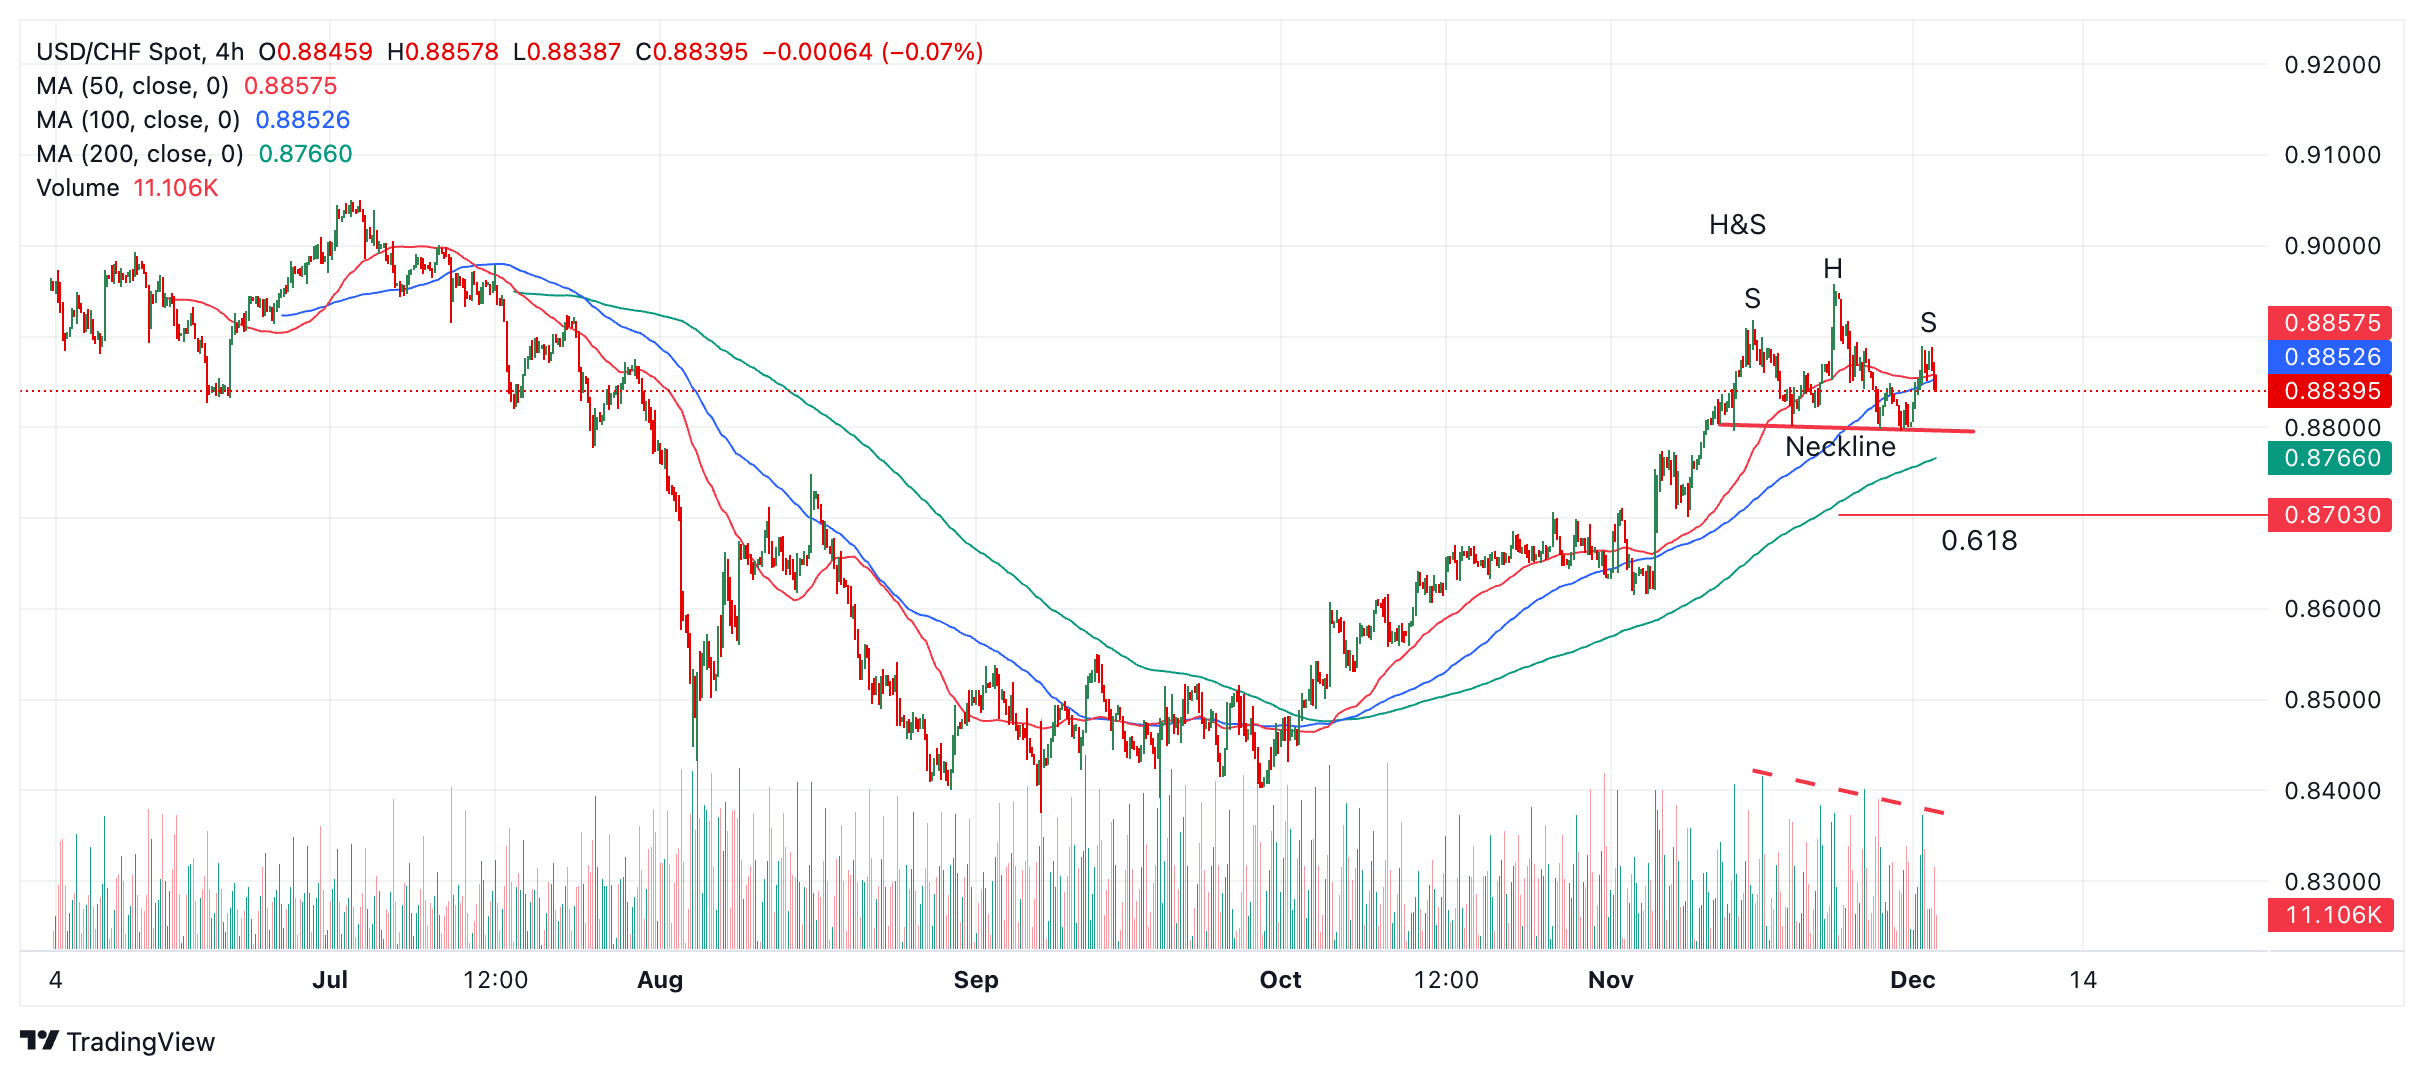
The H&S is made up of a beak, the “head” (H) and two shoulders on each side (S). A break below the neckline at the base of the pattern confirms a decline. The pattern is a bearish reversal signal.
In USD/CHF the neckline is around 0.8797. The initial target for the pattern is 0.8703, the 61.8% Fibonacci extension of the pattern height extrapolated downwards (red line labeled 0.618 on the chart).
Volume has decreased during the formation of the H&S (dashed red line), further reinforcing the validity of the pattern.
Source: Fx Street
I am Joshua Winder, a senior-level journalist and editor at World Stock Market. I specialize in covering news related to the stock market and economic trends. With more than 8 years of experience in this field, I have become an expert in financial reporting.


