
- US Dollar Trims Previous Losses and Returns to Levels Just Below 0.9100
- The doji candle on the weekly chart and the bearish divergence on the intraday chart suggest the possibility of a deeper correction.
- USD/CHF bears need to break above the 0.9075 support level.
The US Dollar has given back previous losses as news of an Israeli attack on Iran prompted the safe-haven CHF to consolidate in previous ranges, above the 0.9075 resistance zone.
On Friday, Chicago Fed President Austen Goolsbee reiterated the lack of progress on inflation and reaffirmed the data-dependent approach to future monetary policy decisions. The Dollar has traded moderately higher after these comments
Economic fundamentals support the Dollar as the Federal Reserve is likely to keep rates elevated for longer, while the SNB has already cut rates and is likely to cut rates again later this year.
USD/CHF technical analysis
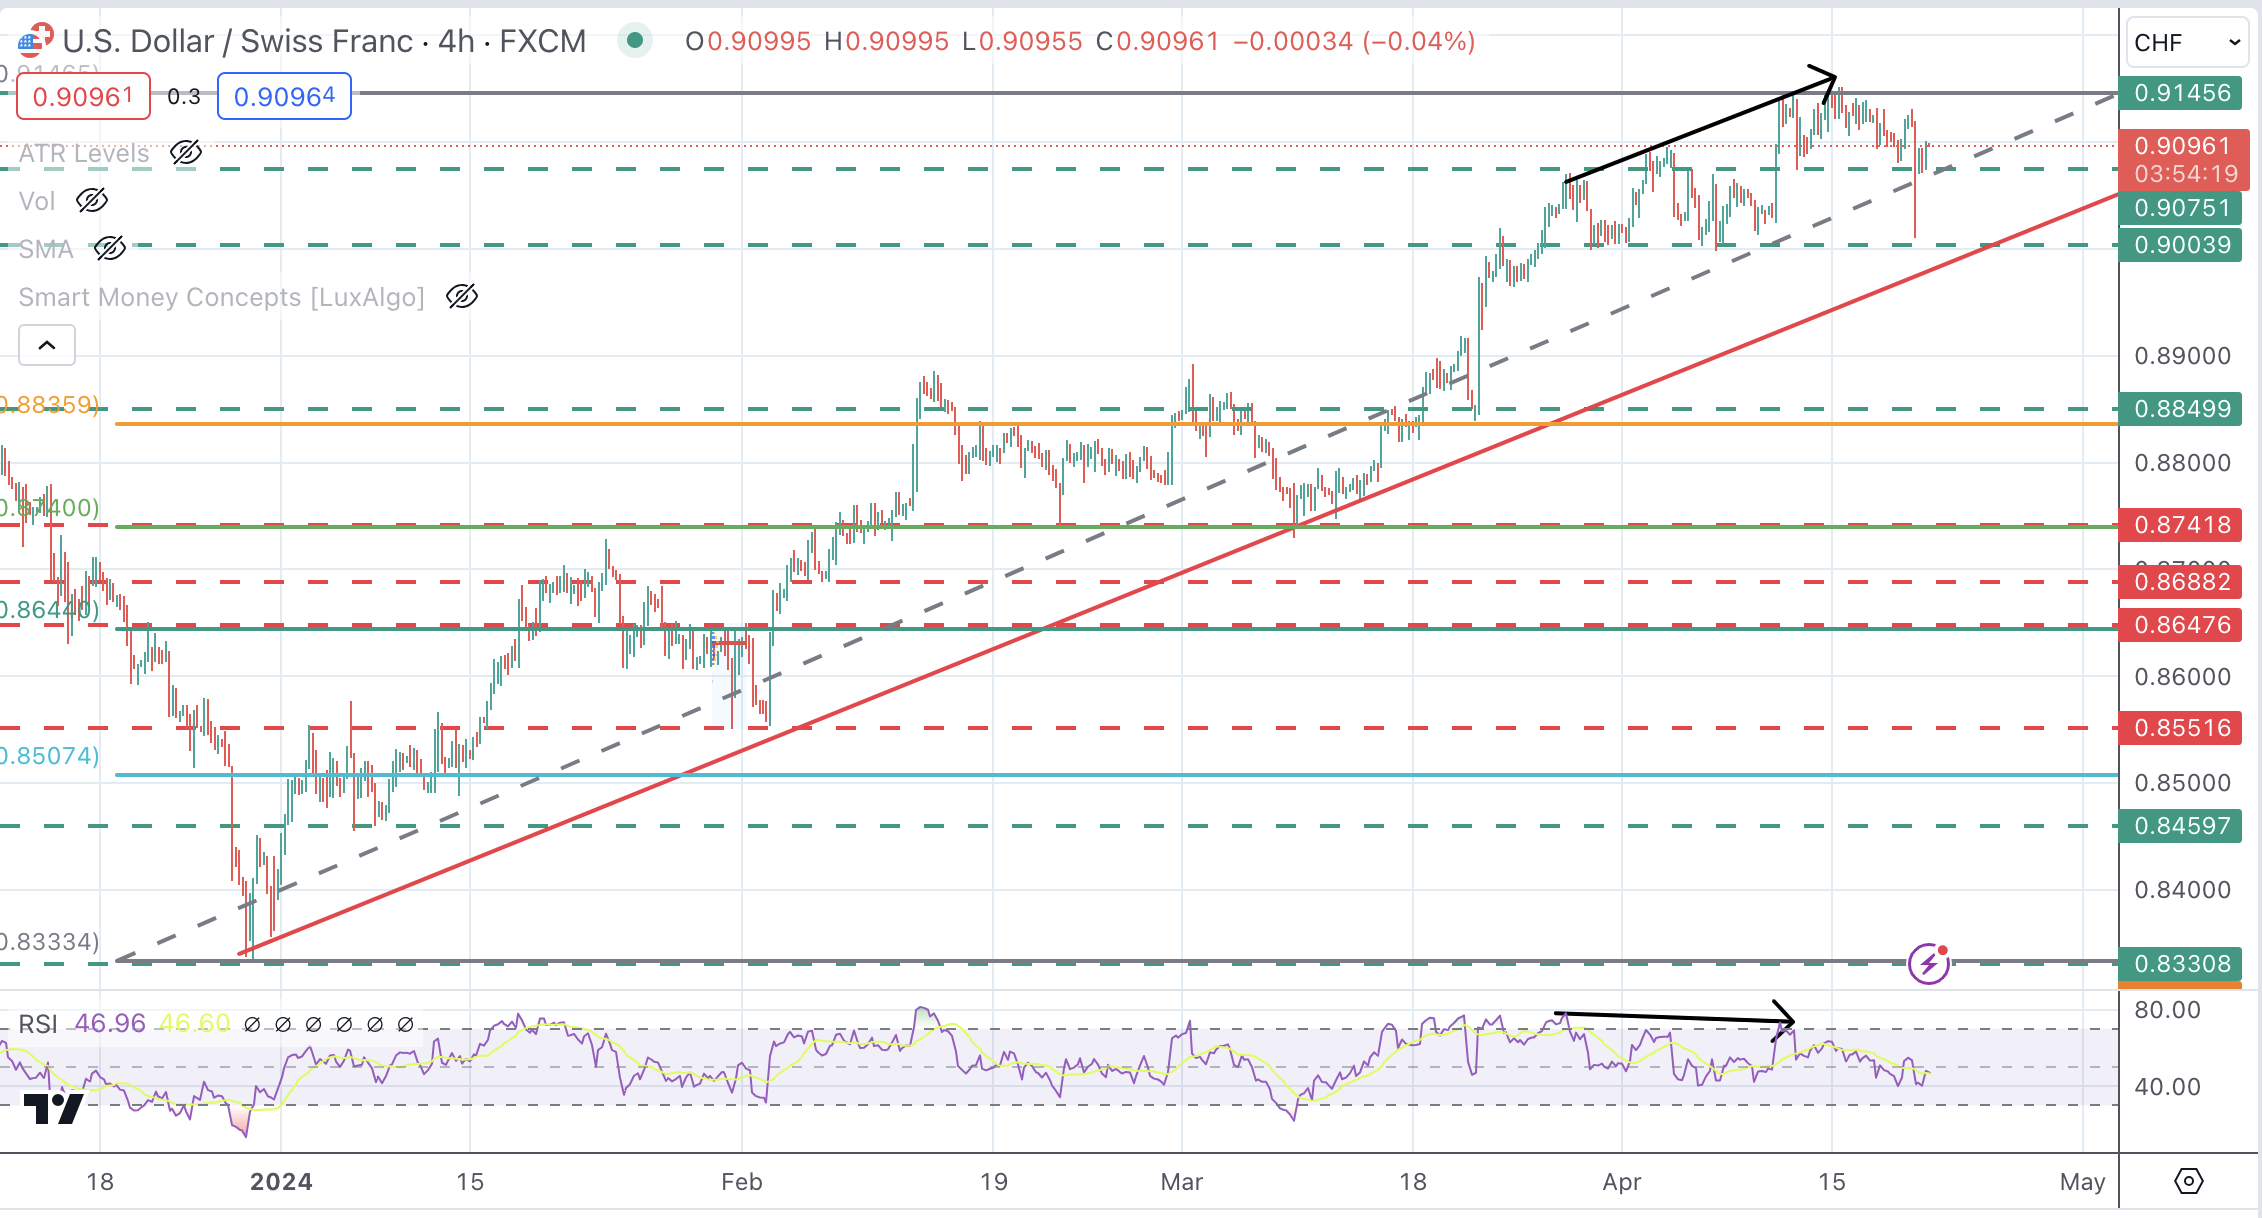
The pair, however, has been trading without a clear direction below the 0.9145 resistance zone after a strong rally since early January. A Doji candle is seen on the weekly chart, which usually indicates a possible correction.
A bearish divergence on the 4-hour chart also points in that direction, although bears need to confirm below 0.9075 to confirm a trend change. Below there, the next targets would be the 0.9000 area and the trend line support at 0.8980. To the upside, a bullish reaction above 0.9245 would expose the October high at 0.9240.
USD/CHF 4-hour chart
Source: Fx Street
I am Joshua Winder, a senior-level journalist and editor at World Stock Market. I specialize in covering news related to the stock market and economic trends. With more than 8 years of experience in this field, I have become an expert in financial reporting.


