
- In the Friday session, USD/CHF recovered above the 0.8965 level.
- Strong US Nonfarm Payrolls data boosted the USD across the board.
- US Treasury yields rose while the odds of a September cut by the Fed decreased slightly.
The pair USD/CHF is seeing a boost after updated US Non-Farm Payrolls (NFP) figures were released on Friday, beating market expectations. As market bets on the Federal Reserve may become more hawkish, divergences with the Swiss National Bank (SNB) could favor the USD.
The newly reported NFP for May expanded to 272,000 from 165,000 (revised April reading), beating market estimates of 185,000. Strong data like this has led to a decrease in the odds of a Fed rate cut in September. The US unemployment rate also increased to 4% from 3.9% previously, with a small decline in the labor participation rate, dropping to 62.5% from 62.7% previously. At the same time, average hourly earnings saw growth of 4.1% annually from a revised 4% in April, indicating an increase in wage inflation.
Following the release of the data, US Treasury yields soared with 2, 5 and 10 year rates rising to 4.80%, 4.44% and 4.41%, causing the USD to gain interest.
On the other hand, the SNB began a easing cycle at its March meeting, reducing rates by 25 basis points to reach 1.5%. So far, the market is predicting a 55% chance of another rate cut at the next meeting scheduled for June 20.
USD/CHF technical analysis
Technically speaking, the pair has recovered to a more favorable position, bringing the indicators out of oversold regions. The RSI now sits near 50, signaling a more balanced market, and the MACD indicator is reporting smaller red bars. There is a clear sign that the pair is regaining positions above the reformed barriers of the 100-day and 200-day SMA, reinforcing the bullish outlook in the near term. The 200-day SMA also adds additional reinforcement to defend against losses.
USD/CHF Daily Chart
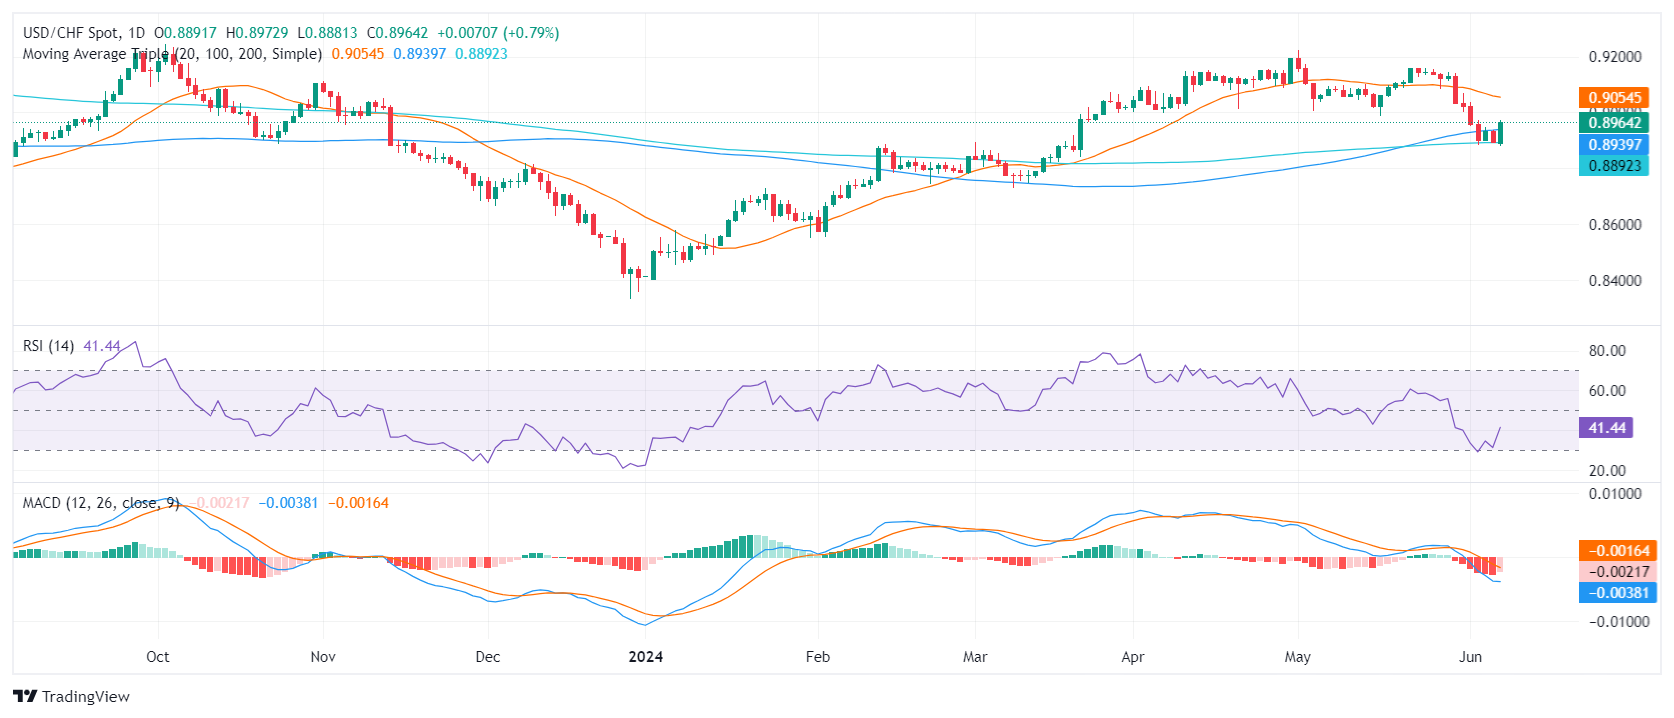
Source: Fx Street
I am Joshua Winder, a senior-level journalist and editor at World Stock Market. I specialize in covering news related to the stock market and economic trends. With more than 8 years of experience in this field, I have become an expert in financial reporting.


