
- USD/CNH attracts some buyers on Thursday and moves away from a more than one-week low.
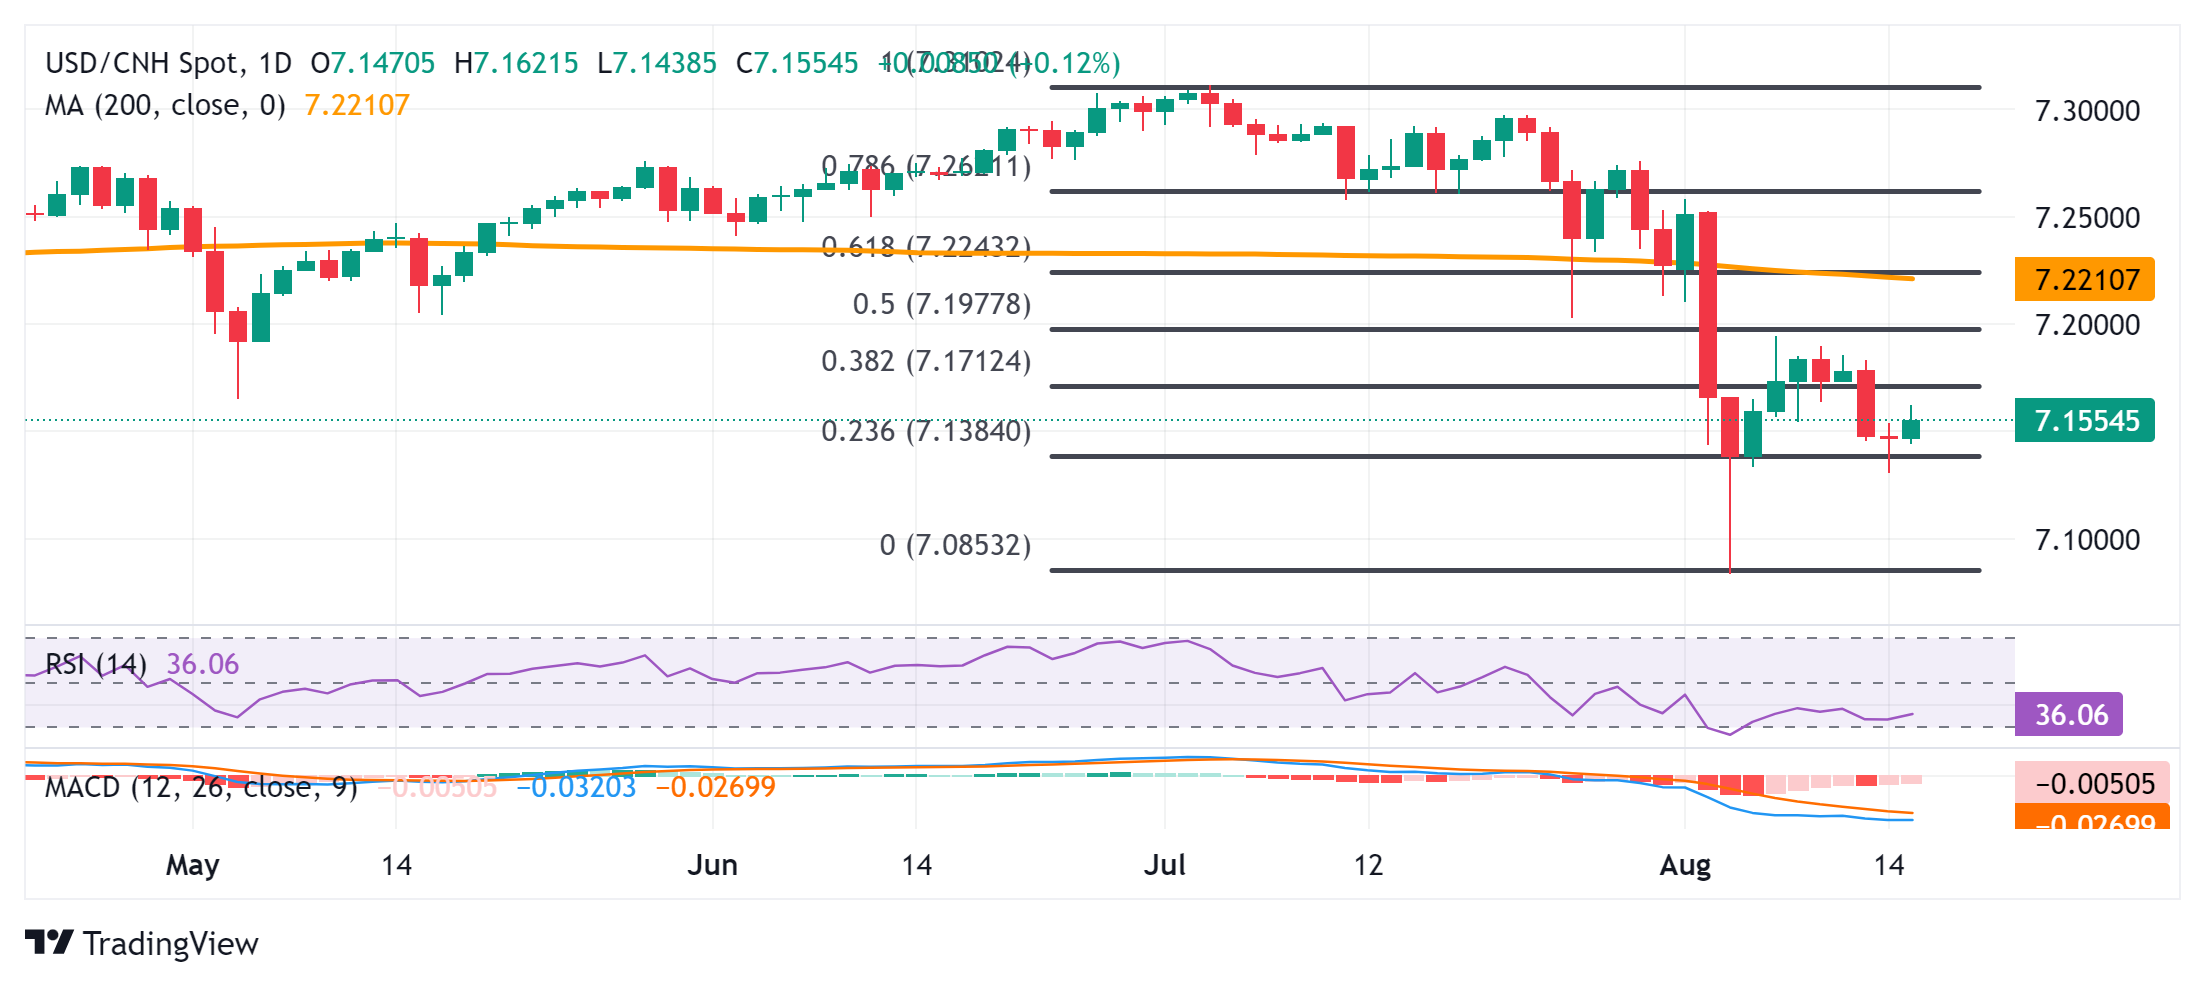
- The technical situation supports the possibility of further selling at higher levels.
- Sustained strength beyond the 50% Fibo level is needed to negate the negative outlook.
The USD/CNH pair extends the previous day’s bounce from the 7.1305-7.1300 zone, or an over-one-week low, and gains some positive traction during the Asian session on Thursday. Spot prices hold on to modest intraday gains near the 7.1560 zone, though the mixed technical setup warrants some caution before positioning for any further upside move.
The USD/CNH pair, so far, has shown some resilience below the 23.6% Fibonacci retracement level of the July-August drop and the subsequent move favors the bullish traders. That said, the oscillators on the daily chart remain deep in the negative territory and are still far from being in the oversold zone. Therefore, any further positive move is more likely to attract fresh sellers near the 7.1845-7.1850 region and remain capped near the 7.1895-7.1900 zone.
The latter is followed by the 50% Fibo level, around the 7.1975-7.1980 zone, which should now act as a key pivot point. A sustained strength beyond the said barrier will suggest that the USD/CNH pair has bottomed out near the 7.0835 region, or the lowest level since June 2023 reached last week, and will pave the way for a significant bullish move.
On the other hand, the 7.1500 level is likely to protect the immediate downside, below which the USD/CNH pair could accelerate the decline back towards challenging the multi-month low, around the 7.0835 region. Some follow-through selling will be seen as a fresh trigger for bearish traders and set the stage for an extension of the recent sharp pullback from the yearly high reached in July.
USD/CNH daily chart
US Dollar PRICE Today
The table below shows the exchange rate of the US Dollar (USD) against major currencies today. The US Dollar was the strongest currency against the Euro.
| USD | EUR | GBP | JPY | CAD | AUD | NZD | CHF | |
|---|---|---|---|---|---|---|---|---|
| USD | 0.04% | -0.05% | 0.01% | -0.02% | -0.31% | 0.03% | -0.01% | |
| EUR | -0.04% | -0.10% | -0.03% | -0.06% | -0.45% | -0.18% | -0.03% | |
| GBP | 0.05% | 0.10% | 0.09% | 0.07% | -0.33% | -0.07% | 0.14% | |
| JPY | -0.01% | 0.03% | -0.09% | -0.05% | -0.36% | -0.14% | 0.05% | |
| CAD | 0.02% | 0.06% | -0.07% | 0.05% | -0.30% | -0.11% | 0.10% | |
| AUD | 0.31% | 0.45% | 0.33% | 0.36% | 0.30% | 0.25% | 0.46% | |
| NZD | -0.03% | 0.18% | 0.07% | 0.14% | 0.11% | -0.25% | 0.21% | |
| CHF | 0.00% | 0.03% | -0.14% | -0.05% | -0.10% | -0.46% | -0.21% |
The heatmap shows percentage changes of major currencies. The base currency is selected from the left column, while the quote currency is selected from the top row. For example, if you choose the US Dollar from the left column and move along the horizontal line to the Japanese Yen, the percentage change shown in the chart will represent the USD (base)/JPY (quote).
Source: Fx Street
I am Joshua Winder, a senior-level journalist and editor at World Stock Market. I specialize in covering news related to the stock market and economic trends. With more than 8 years of experience in this field, I have become an expert in financial reporting.


