
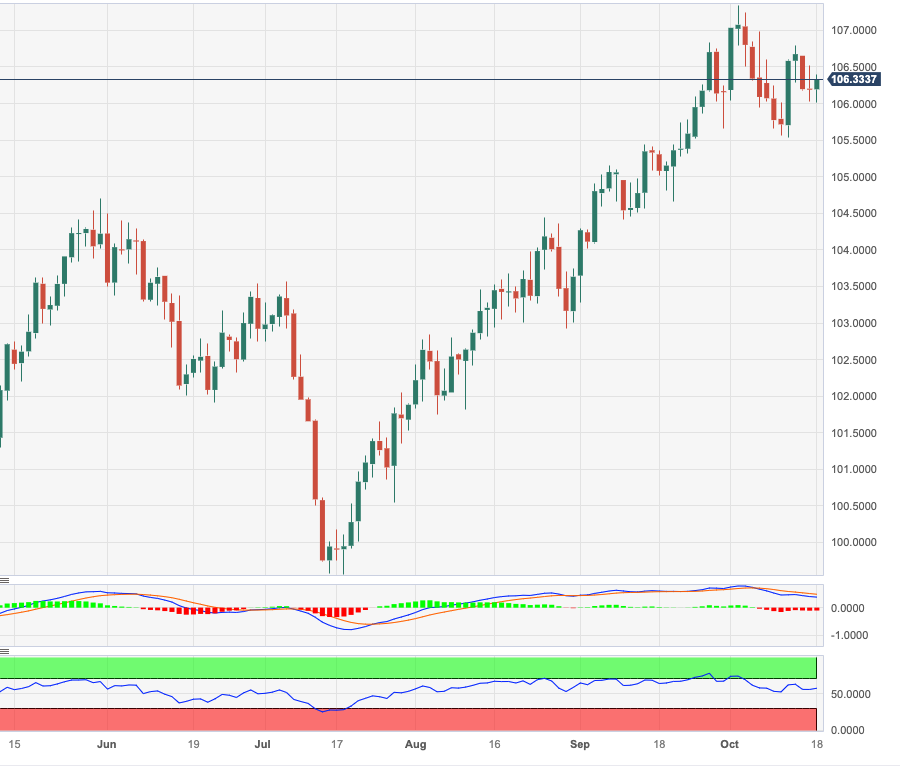
- DXY gains bullish momentum and reverses two consecutive daily pullbacks.
- The continuation of the rebound is aimed at the 106.80 area.
He DXY It leaves behind the pessimism observed in the first half of the week and revisits the lows of 106.00 on Wednesday.
Should bullish momentum accelerate, breaking the weekly high of 106.78 (Oct 12) could encourage the index to embark on a possible test of the 2023 high of 107.34 (Oct 3) on the near-term horizon.
Meanwhile, as long as it remains above the key 200-day SMA, today at 103.25, the outlook for the index is expected to remain constructive.
DXY Daily Chart
Source: Fx Street
I am Joshua Winder, a senior-level journalist and editor at World Stock Market. I specialize in covering news related to the stock market and economic trends. With more than 8 years of experience in this field, I have become an expert in financial reporting.


