
- The Indian Rupee gained ground in the Asian session on Monday.
- High oil prices could put pressure on the INR, while renewed demand for US dollars could limit the local currency’s gains.
- Investors are awaiting the US Chicago Fed National Activity Index ahead of India’s Federal Budget on Tuesday.
The Indian Rupee (INR) is trading with a slight positive bias on Monday amid weakness in the US Dollar (USD). Mounting speculations about an easing move by the Federal Reserve (Fed) in September have weighed on the Dollar in previous sessions. However, high demand for USD, especially for defence and oil payments, could exert some selling pressure on the local currency. The downside of the INR could be limited amid the likely intervention by the Reserve Bank of India (RBI) to prevent a sharp depreciation of the Indian Rupee.
The US Chicago Fed National Activity Index for June will be released on Monday. Highlights this week will be the US S&P Global Flash Purchasing Managers’ Index (PMI) for July, second quarter Gross Domestic Product (GDP) and Personal Consumption Expenditure (PCE) Price Index data for June, which will be released on Wednesday, Thursday and Friday respectively. On the Indian docket, traders will be keeping an eye on the Indian Union Budget on Tuesday.
Daily Market Wrap: Indian Rupee Appreciates on Weak US Dollar
- The Indian rupee closed at a record low of 83.6625 against the US dollar on Friday, with intervention by the Reserve Bank of India (RBI) likely to stem losses. The currency fell 0.1% on the week, according to Reuters.
- India’s benchmark equity index BSE Sensex fell 739 points, or 0.91%, to 80,605 on Friday. Meanwhile, the Nifty index closed at 24,531, down 270 points, or 1.1% from its previous close.
- “We expect the rupee to trade with a slight negative bias on weak global markets and strength in the US dollar. Weak Asian and European currencies could also weigh on the rupee,” said Anuj Choudhary, Research Analyst at Sharekhan by BNP Paribas.
- New York Federal Reserve President John Williams said Friday that a rate cut could be warranted in the coming months, but not at the July policy meeting, according to WSJ.
- Financial markets are now pricing in the likelihood of a move at their July meeting at less than 5% and almost fully pricing in a firmly expected rate cut in September, according to CME’s FedWatch tool.
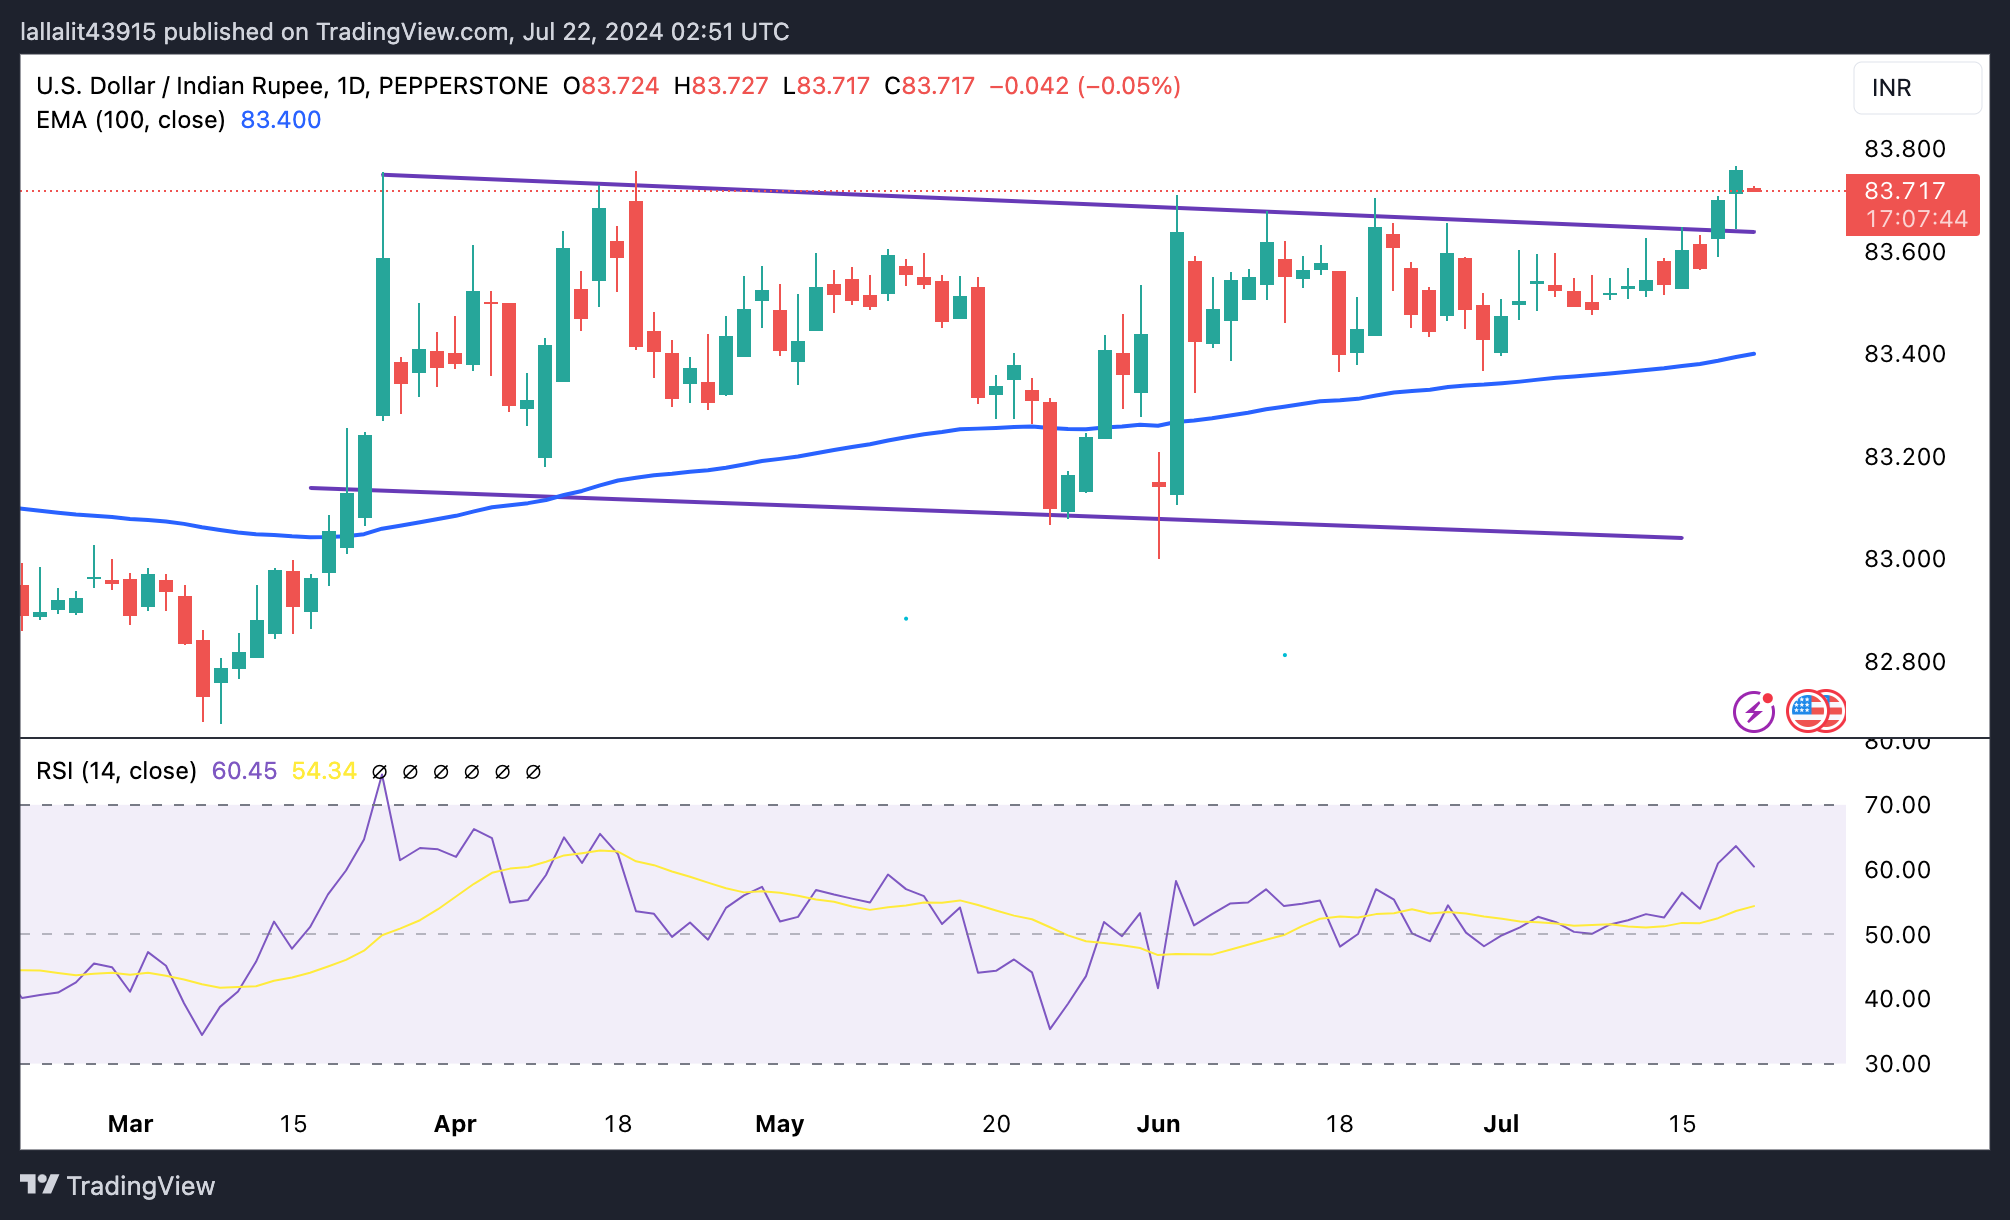
Technical Analysis: USD/INR maintains a long-term bullish vibe
The Indian Rupee is trading higher on the day. The uptrend has been in play for the USD/INR pair as it has confirmed a break above the one-month trading range while holding above the 100-day exponential moving average (EMA) on the daily chart. Moreover, the bullish momentum is also supported by the 14-day Relative Strength Index (RSI) pointing higher above 63.60, suggesting that more upside could be on the horizon.
The immediate resistance level for the pair will emerge at the all-time high of 83.77. The crucial hurdle is seen at the psychological level of 84.00.
On the downside, the resistance-turned-support level at 83.65 acts as an initial containment level. The additional downside filter to watch is 83.51 (July 12 low), followed by 83.40 (100-day EMA).
US Dollar Price Today
The table below shows the percentage change of the US Dollar (USD) against the major currencies listed today. The US Dollar was the weakest against the Euro.
| USD | EUR | GBP | CAD | AUD | JPY | NZD | CHF | |
| USD | 0.06% | 0.08% | 0.13% | 0.36% | 0.12% | 0.36% | 0.10% | |
| EUR | -0.09% | 0.00% | 0.06% | 0.28% | 0.03% | 0.29% | 0.01% | |
| GBP | -0.08% | -0.02% | 0.04% | 0.27% | 0.01% | 0.28% | 0.00% | |
| CAD | -0.13% | -0.06% | -0.04% | 0.22% | -0.02% | 0.24% | -0.05% | |
| AUD | -0.36% | -0.28% | -0.27% | -0.21% | -0.25% | 0.03% | -0.26% | |
| JPY | -0.12% | -0.01% | -0.03% | 0.03% | 0.23% | 0.26% | -0.03% | |
| NZD | -0.35% | -0.29% | -0.28% | -0.24% | -0.01% | -0.24% | -0.28% | |
| CHF | -0.08% | 0.00% | 0.01% | 0.06% | 0.28% | 0.02% | 0.29% |
The heatmap shows the percentage changes of the major currencies relative to each other. The base currency is chosen from the left column, while the quote currency is chosen from the top row. For example, if you choose the Euro from the left column and move along the horizontal line to the Japanese Yen, the percentage change shown in the chart will represent EUR (base)/JPY (quote).
Source: Fx Street
I am Joshua Winder, a senior-level journalist and editor at World Stock Market. I specialize in covering news related to the stock market and economic trends. With more than 8 years of experience in this field, I have become an expert in financial reporting.


