
- Indian Rupee weakens in early Asian session on Friday.
- Renewed demand for US dollars and recovery in crude oil prices undermine the INR.
- India’s Consumer Price Index (CPI) and US Producer Price Index (PPI) for June will be the highlights on Friday.
The Indian Rupee (INR) lost traction on Friday amid modest recovery in the US Dollar (USD). Demand for the Dollar from state-owned banks and local importers limited the potential gains for the INR. Moreover, the rally in crude oil prices also put some selling pressure on the local currency as India is the third-largest consumer of crude oil in the world after the US and China.
On the other hand, positive trends in the Indian stock market, sustained foreign capital inflows and strong macroeconomic growth in India could benefit the INR. Moreover, rising expectations of a US Federal Reserve (Fed) rate cut in September following softer US inflation data are likely to weigh on the USD and limit the upside of the USD/INR pair in the near term.
Later on Friday, investors will be on the lookout for India’s Consumer Price Index (CPI) data, which is expected to show a 4.8% rise in June. Industrial Production and Manufacturing Output will also be released. On the US agenda, the Producer Price Index (PPI) for June and the preliminary Michigan Consumer Sentiment indicator for July will be released.
Daily Market Movers Roundup: Indian Rupee remains sensitive to multiple headwinds
- The International Monetary Fund (IMF) estimates that shifting jobs to construction, services and manufacturing could boost India’s GDP growth by 0.2 to 0.5 percentage points.
- The U.S. Consumer Price Index (CPI) rose 3.0% on an annual basis in June, compared with a 3.3% increase in May. This reading was below the market consensus of 3.1%, according to the U.S. Bureau of Labor Statistics (BLS) on Thursday. On a monthly basis, the CPI declined 0.1% month-on-month in June, the lowest level in more than three years.
- The annual core CPI, which excludes volatile food and energy prices, rose 3.3% year-on-year in June, below the forecast and the 3.4% increase in May. The figure rose 0.1% on a monthly basis.
- Chicago Federal Reserve Bank President Austan Goolsbee on Friday called the recent inflation report “excellent,” adding that the reports provided evidence that the central bank is on track to hit its 2% target.
- San Francisco Federal Reserve Bank President Mary Daly acknowledged improving inflation figures on Thursday. Daly expects further easing of both price pressures and the labor market to justify interest rate cuts.
- Financial markets saw a nearly 85% chance of a Fed rate cut in September, up from a 70% probability seen before the CPI report. Two rate cuts are anticipated this year.
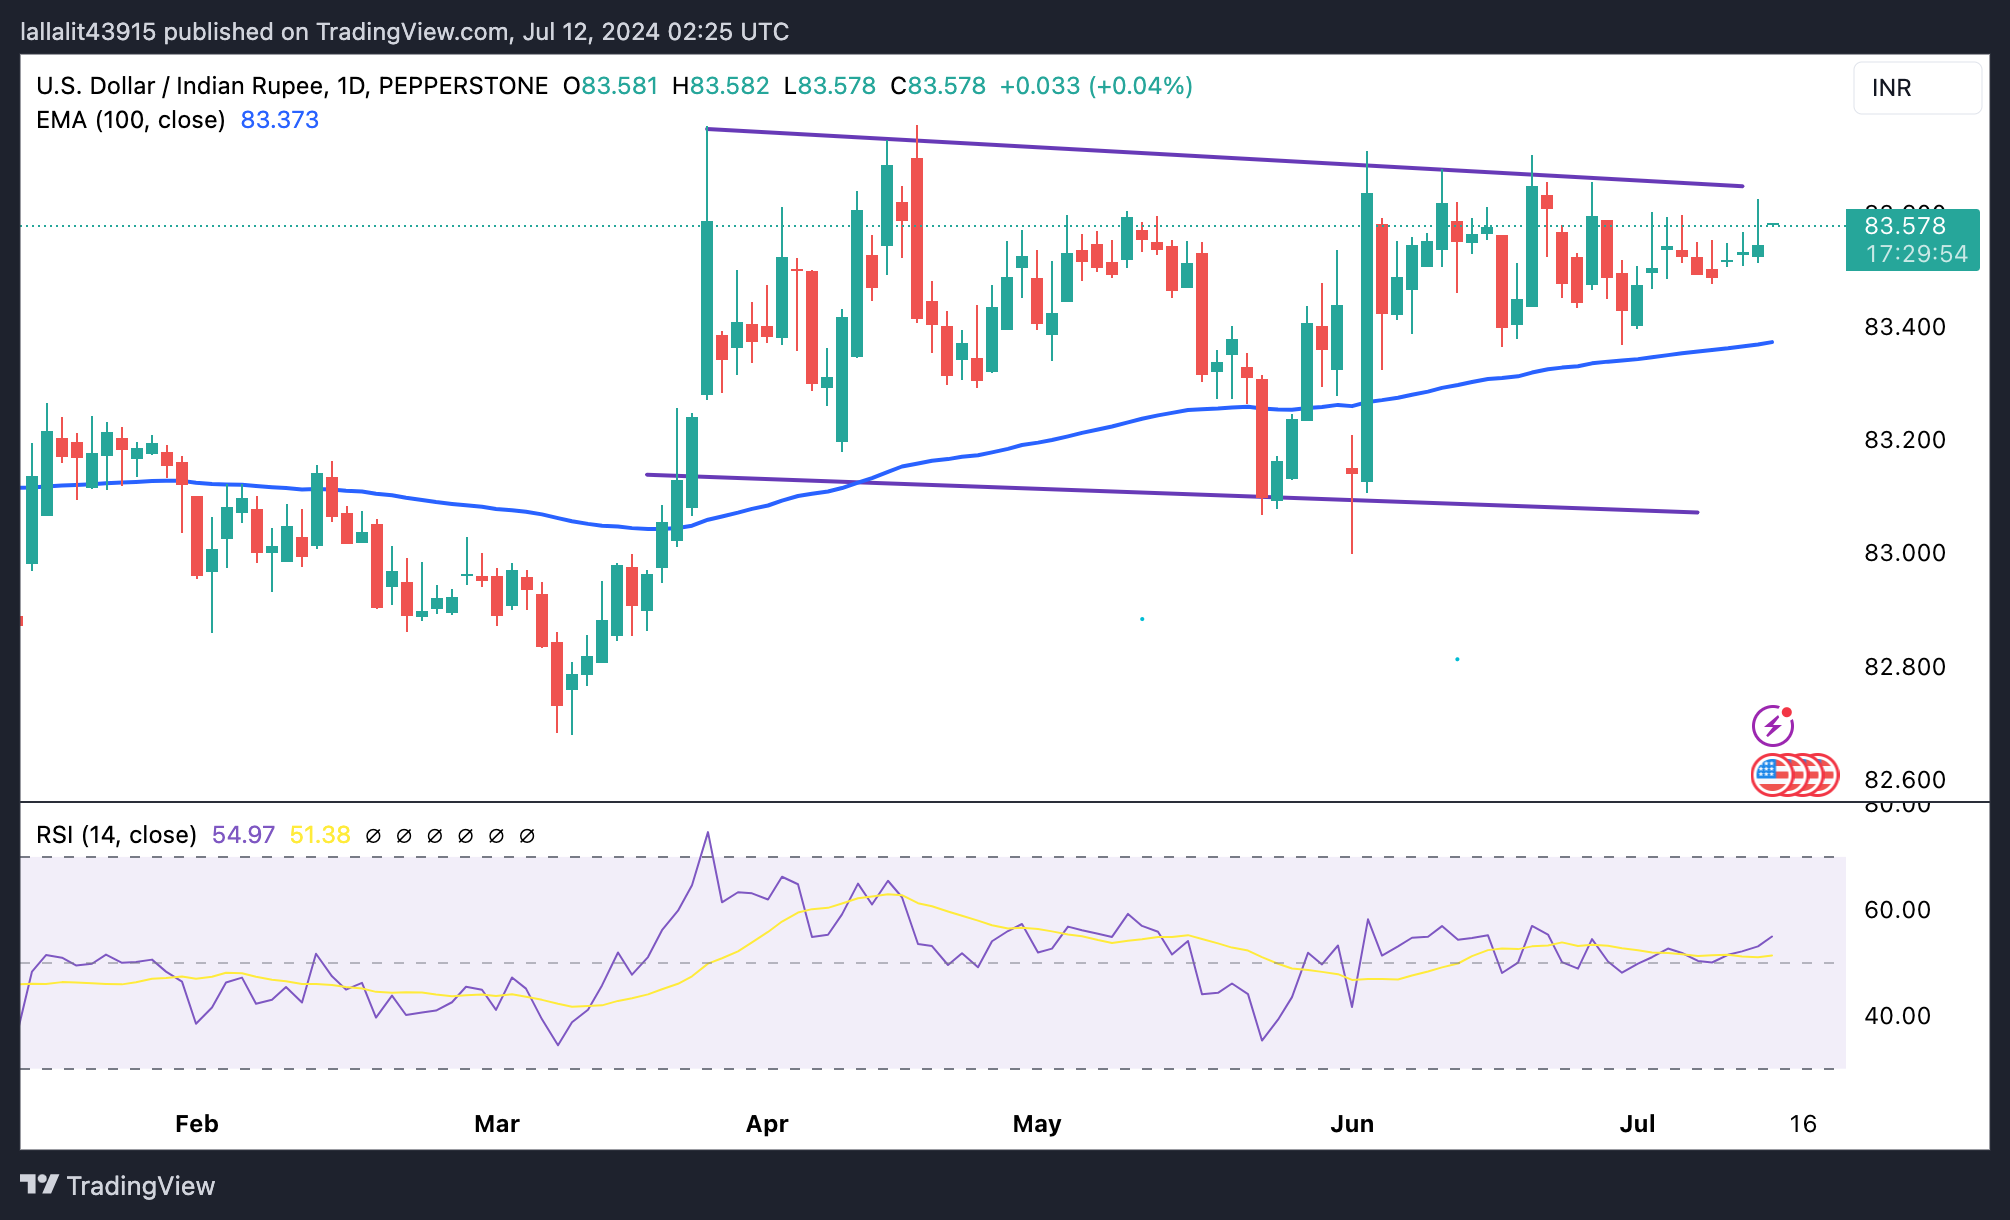
Technical Analysis: USD/INR Enters Short-Term Consolidation
The Indian Rupee is trading weaker on the day. As per the daily chart, the USD/INR pair is maintaining the bullish vibe unchanged above the key 100-day exponential moving average (EMA). The 14-day Relative Strength Index (RSI) is holding in the bullish territory above the 50-midline, suggesting that the EMA support is likely to hold rather than break. However, in the near term, the pair has remained within its monthly range since March 21.
Any follow-through buying above the upper limit of the trading range at 83.65 could lead to a retest of the all-time high of 83.75. Extended gains will see a rally towards the psychological barrier of 84.00.
Sustained trading below the 100-day EMA at 83.37 could pave the way towards the round 83.00 mark. The next downside target is seen at 82.82, a low of January 12.
US Dollar Price Today
The table below shows the percentage change of the US Dollar (USD) against the major currencies listed today. The US Dollar was the strongest against the Japanese Yen.
| USD | EUR | GBP | CAD | AUD | JPY | NZD | CHF | |
| USD | 0.07% | 0.14% | 0.06% | 0.15% | 0.71% | 0.02% | 0.09% | |
| EUR | -0.07% | 0.05% | -0.02% | 0.11% | 0.56% | -0.06% | 0.00% | |
| GBP | -0.14% | -0.07% | -0.08% | 0.06% | 0.53% | -0.11% | -0.05% | |
| CAD | -0.05% | 0.01% | 0.08% | 0.12% | 0.61% | -0.03% | 0.03% | |
| AUD | -0.15% | -0.12% | -0.06% | -0.14% | 0.47% | -0.17% | -0.13% | |
| JPY | -0.72% | -0.68% | -0.55% | -0.64% | -0.51% | -0.64% | -0.57% | |
| NZD | -0.04% | 0.04% | 0.11% | 0.03% | 0.16% | 0.61% | 0.05% | |
| CHF | -0.09% | -0.01% | 0.05% | -0.02% | 0.11% | 0.56% | -0.05% |
The heatmap shows the percentage changes of the major currencies relative to each other. The base currency is chosen from the left column, while the quote currency is chosen from the top row. For example, if you choose the Euro from the left column and move along the horizontal line to the Japanese Yen, the percentage change shown in the chart will represent EUR (base)/JPY (quote).
Source: Fx Street
I am Joshua Winder, a senior-level journalist and editor at World Stock Market. I specialize in covering news related to the stock market and economic trends. With more than 8 years of experience in this field, I have become an expert in financial reporting.


