- The Indian Rupee is trading sideways during Asian trading hours on Monday.
- Elevated geopolitical risks in the Middle East could boost the pair, while a possible RBI intervention could limit the upside.
- CPI and Indian Industrial Production data will be the highlights on Monday.
The Indian Rupee (INR) is trading unchanged on Monday amid a strengthening Dollar. Traders are cautious about geopolitical risks. The US is strengthening its capabilities in the Middle East by sending an additional guided missile submarine to the region “in light of rising regional tensions,” according to ABC News. This could boost a safe-haven currency like the US Dollar (USD) in the near term. However, the likely intervention by the Reserve Bank of India (RBI) could support the local currency and limit the significant upside of the pair.
Looking ahead, traders will be keeping an eye on the release of the Consumer Price Index (CPI) and Industrial Production in India. On the US agenda, the Producer Price Index (PPI), Consumer Price Index (CPI) and Retail Sales will be released later this week. Softer inflation data could reinforce expectations that the Federal Reserve (Fed) will start cutting interest rates soon, which could drag the Dollar lower.
Daily Market Wrap: Indian Rupee Steady Ahead of India CPI Report
- Amit Somani, senior fund manager, fixed income, Tata Asset Management, said the balance of risks on the Indian rupee remains on the downside, adding that he expects the currency to move in the range of 83.80-84.20 during the week.
- “The Reserve Bank of India (RBI) has been keeping a close eye on the rupee’s movement and has intervened in the spot market to ensure that it remains close to 84,” said Jigar Trivedi, senior analyst at Reliance Securities.
- India’s CPI is expected to show a rise of 3.65% year-on-year in July, compared with 5.08% in the previous reading.
- The Israeli intelligence community believes Iran has decided to attack Israel directly and could do so within days, Axios reporter Barak Ravid said Sunday, citing two sources.
- Fed Governor Michelle Bowman said on Sunday she sees progress in reducing inflation in the past few months, but inflation remains uncomfortably above the Fed’s 2% target, signaling that the Fed may not be ready to cut rates at its next meeting in September, according to Reuters.
- The CME FedWatch tool showed the likelihood of a 50 basis point (bps) interest rate cut by the Fed at its September meeting at 52.5%, up from 57.5% a day earlier.
Technical Analysis: USD/INR Positive Stance Remains Unchanged
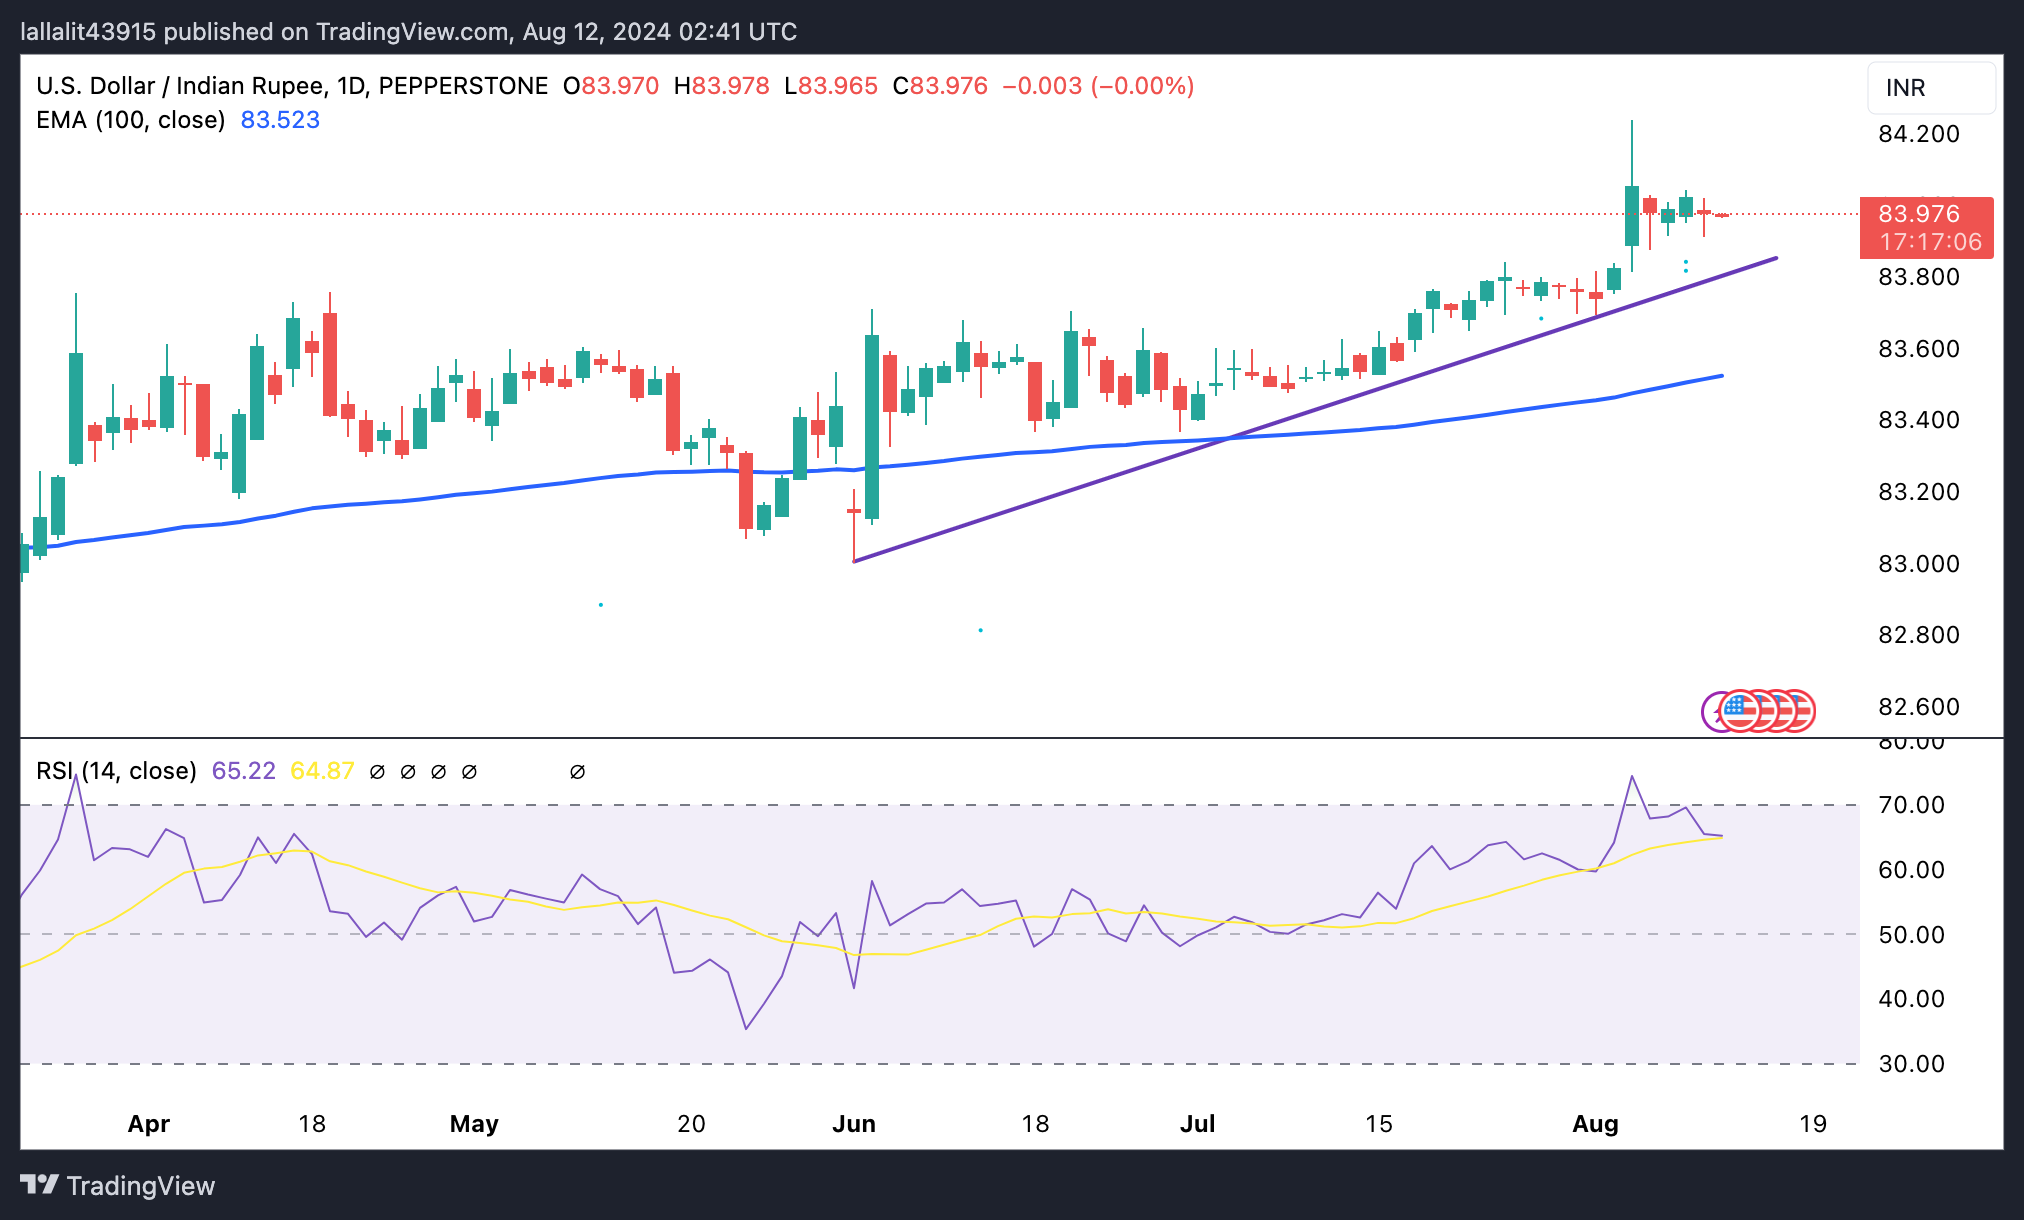
The Indian Rupee is trading unchanged on the day. However, the USD/INR pair is showing a significant upward movement on the daily chart, with the price holding above the 100-day exponential moving average (EMA) and the two-month uptrend line. The bullish momentum is supported by the 14-day Relative Strength Index (RSI), which is hovering near 65.50, suggesting a continuation of the uptrend.
A decisive bullish break above the psychological barrier of 84.00 could pave the way towards the all-time high of 84.24. If the rally continues, it could lead the pair to 84.50.
On the downside, a bearish reversal could take the USD/INR back to the uptrend line near 82.82. A sustained trade below this level will see a drop to the 100-day EMA at 83.52.
US Dollar Price This Week
The table below shows the percentage change of the US Dollar (USD) against the major currencies listed this week. The US Dollar was the weakest against the Australian Dollar.
| USD | EUR | GBP | CAD | AUD | JPY | NZD | CHF | |
| USD | -0.05% | -0.09% | -0.02% | -0.23% | -0.09% | -0.23% | 0.02% | |
| EUR | 0.05% | -0.03% | 0.03% | -0.16% | -0.03% | -0.17% | 0.07% | |
| GBP | 0.08% | 0.03% | 0.06% | -0.14% | 0.00% | -0.14% | 0.10% | |
| CAD | 0.02% | -0.03% | -0.06% | -0.19% | -0.07% | -0.22% | 0.04% | |
| AUD | 0.23% | 0.16% | 0.13% | 0.20% | 0.13% | 0.00% | 0.25% | |
| JPY | 0.12% | 0.05% | 0.01% | 0.06% | -0.13% | -0.13% | 0.12% | |
| NZD | 0.22% | 0.17% | 0.14% | 0.20% | 0.01% | 0.12% | 0.24% | |
| CHF | -0.02% | -0.08% | -0.11% | -0.04% | -0.24% | -0.11% | -0.25% |
The heatmap shows the percentage changes of the major currencies relative to each other. The base currency is chosen from the left column, while the quote currency is chosen from the top row. For example, if you choose the Euro from the left column and move along the horizontal line to the Japanese Yen, the percentage change shown in the chart will represent EUR (base)/JPY (quote).
Source: Fx Street
I am Joshua Winder, a senior-level journalist and editor at World Stock Market. I specialize in covering news related to the stock market and economic trends. With more than 8 years of experience in this field, I have become an expert in financial reporting.


