
- USD/JPY is picking up ground after the US ISM Non-Manufacturing PMI for August beat expectations, coming in at 54.5 vs. 52.5 expected.
- US Treasury yields soar, with the 10-year note rate gaining 10 basis points to 4.296% as traders reconsider a November Fed rate hike.
- Japanese authorities weigh options amid currency speculation; traders should keep an eye on the 148.00/150.00 range.
The dollar regained some of the lost ground against the Japanese yen on Wednesday after US data surprised markets. This triggered a jump in the USD/JPY pair, which is trading volatilely around 147.30/98, still in negative territory.
USD/JPY remains volatile after surprising US ISM report; rising US bond yields
The Institute for Supply Management (ISM) revealed the non-manufacturing PMI for August, also called services, which showed that business activity is gaining traction. The reading stood at 54.5, versus the 52.5 expected, and above the 52.7 in July. The subcomponent of the price index rose to 58.9 in August, compared to 56.8 in July.
Although the latest inflation readings show that the US Federal Reserve’s (Fed) work is on track to hit its 2% target, the latest report from the Fed’s preferred inflation gauge, the PCE, rose 3.3%. in July, which is a small setback in its task. In view of this and the latest ISM report, traders are once again putting a 25 basis point rate hike on the table in November, which would mean that the federal funds rate (FFR) would be in the 5.50 range. %-5.75%
Consequently, US Treasury yields soared, with the 10-year yield at 4.296% gaining 10 basis points, while the US Dollar Index hit a high of seven months of 105,024, up 0.21% on the day.
USD/JPY pared some losses after news in the Asian session that Japanese authorities were considering options amid currency speculation. Therefore, market participants and policymakers will be looking closely at the 148.00/150.00 range, so caution is advised before placing further long bets on the pair.
The Japanese economic agenda will include a speech by Nakagawa of the Bank of Japan. In the US, jobless claims and speeches by various Fed officials could guide the US central bank’s monetary policy.
USD/JPY Price Analysis: Technical Perspective
From a technical point of view, USD/JPY remains biased to the upside, and could challenge the 148.00 figure were it not for the Japanese authorities threatening to intervene in the currency markets to boost their currency. The next resistance would be the daily high from November 1 at 148.82. To the downside, risks arise at support at 147.37, which became last week’s high, followed by the 147.00 signal. The breaking of this last support would jeopardize the stability of the currency. A break of the latter would expose the Tenkan-Senat 146.12.
USD/JPY Price Action – Daily Chart
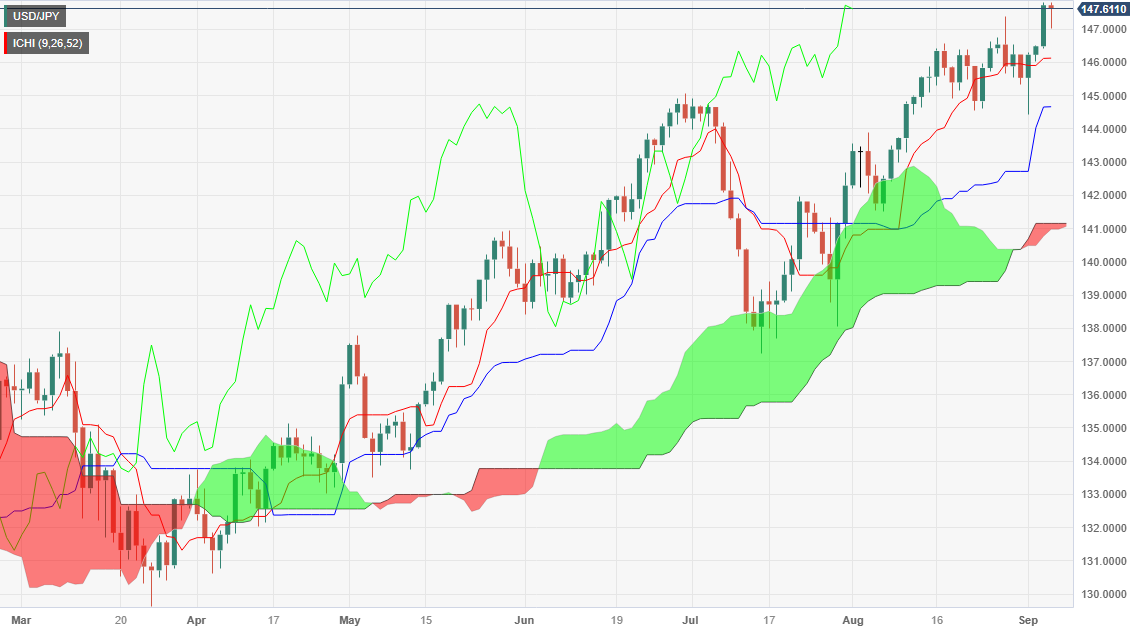
Source: Fx Street
I am Joshua Winder, a senior-level journalist and editor at World Stock Market. I specialize in covering news related to the stock market and economic trends. With more than 8 years of experience in this field, I have become an expert in financial reporting.


