
- The USD/JPY pair rises to 143.53 despite the weakening of the USD in the currency market and the fall in US Treasury bond yields.
- Inflation Anticipation: Wall Street is awaiting July CPI, which is expected to hold steady at 0.2%m/m.
- Mixed signals from the Fed are rocking the market, with officials hinting at a tightening and others suggesting a steady rate path.
He USD/JPY advances for three straight days, rising 0.11%, despite falling US Treasury yields and overall US dollar (USD) weakness across the currency board, before the release of inflation data for the United States (US). At the time of writing, the USD/JPY pair is trading at 143.53, after reaching a low of 142.98.
Uncertainty about the Federal Reserve’s stance and Japanese monetary policy dynamics will dictate the direction of USD/JPY
Wall Street is trading with minimal losses amid a light US economic calendar as traders brace for July inflation data. The Consumer Price Index (CPI) is expected to remain unchanged from 0.2%m/m in June, while market analysts forecast a fall to 3% from 3.3%y/y. The core CPI is estimated to stand at 0.2% m/m, the same as in the previous month’s publication, and to remain at 4.8% yoy in June.
Aside from this, the narrowing of the Trade Deficit slightly boosted the dollar, but mixed messages from US Federal Reserve (Fed) officials keep investors uncertain about the Fed’s future trajectory. Although the governor Fed chair Michelle Bowman insisted on the need for additional tightening, there are more policymakers taking a more cautious or neutral approach, such as Philadelphia Fed President Patrick Harker. He said the Fed is in a phase where it could keep rates on hold barring a sharp turn in the direction of the latest economic data.
Fed policy expectations show that money market traders expect no change in the Federal Funds Rate (FFR), with odds of 86.5%, CME’s FedWatch tool shows.
The Dollar Index (DXY), a gauge of the value of the USD against a basket of six currencies, is losing some traction, down 0.11% at 102.430, undermined by falling US Treasury yields The US 10-year bond yield is 4.00%, down two basis points.
The lack of economic data out of Japan would keep traders on the lookout for dollar dynamics, as well as the latest data from the Bank of Japan (BOJ), as most of its members expressed their view on yield curve control. (Y.C.C.). Despite some talk of monetary policy normalization, most BOJ members remain on the dovish side of the spectrum.
USD/JPY Price Analysis: Technical Perspective
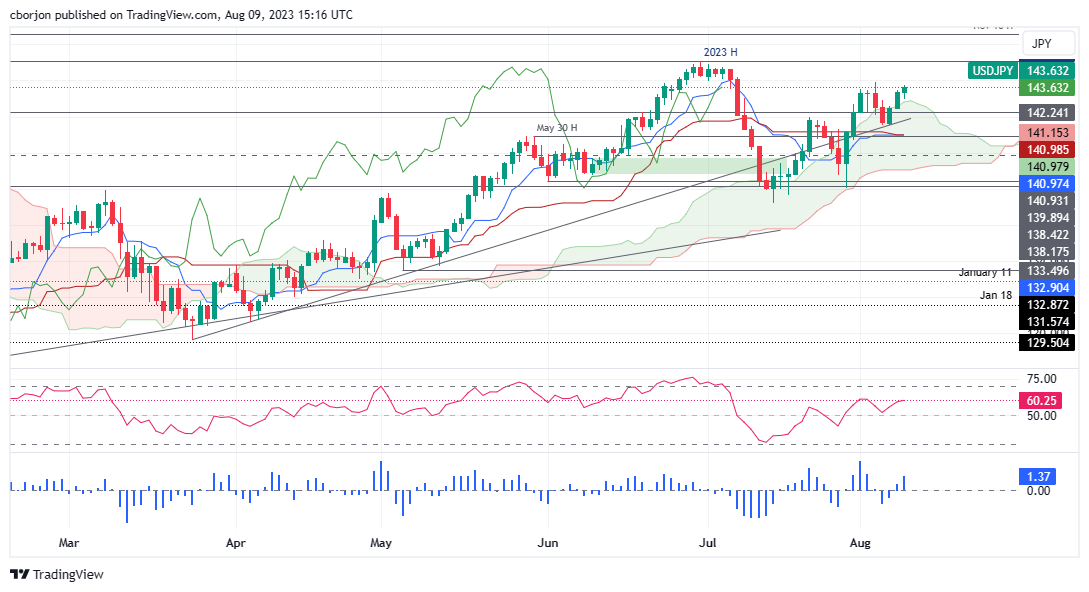
USD/JPY found support around the top of the Ichimoku (Kumo) cloud, briefly pierced on Monday. However, a “tweezer bottom and harami” pattern exacerbated a rally towards current exchange rates. Also, the Tenkan-Sen is about to cross above the Kijun-Sen line, seen as a bullish sign, while the Chikou Span remains below the price action. That being said, USD/JPY is bullish, and could test the year-to-date high at 145.07, but it would have to break through key resistance levels first, such as the 144.00 psychological figure. Conversely, if the main pair breaks into the Kumo, it could test the current week’s low at 141.50.
Source: Fx Street
I am Joshua Winder, a senior-level journalist and editor at World Stock Market. I specialize in covering news related to the stock market and economic trends. With more than 8 years of experience in this field, I have become an expert in financial reporting.


