
- US Nonfarm Payrolls for December weakened the dollar, despite the fact that the labor market remains tight.
- The dovishness in Average Hourly Earnings prompted speculation of a dovish move by the Federal Reserve at the February meeting.
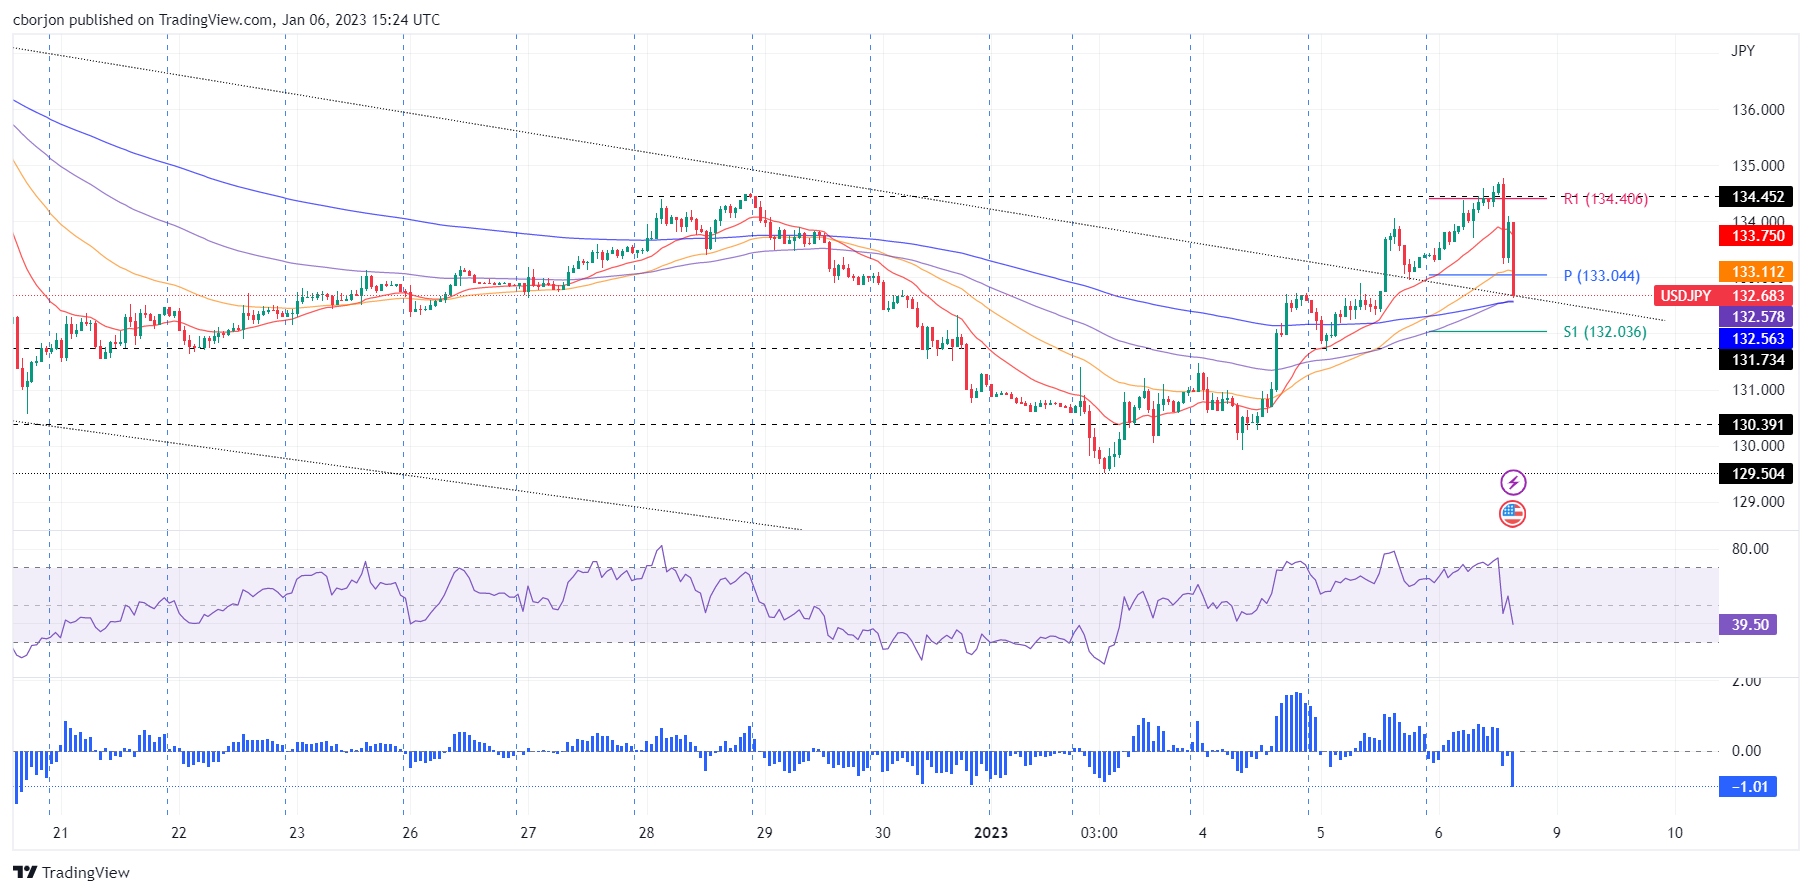
- USD/JPY Price Analysis: Likely to remain biased to the downside below 133.00.
USD/JPY struggles against the 200-day EMA around 134.82, dipping below 134.00, after US economic data, while positive, weighed on the US dollar, exacerbating a 100 point drop in the main pair. At the time of writing, USD/JPY is trading at 132.81, 0.44% below its opening price.
The US Department of Labor revealed that nonfarm payrolls for December rose by 223,000, above estimates of 200,000, according to data released Friday. The unemployment rate fell to 3.5% yoy, against estimates of 3.7%, while average hourly earnings rose 4.6%, below market consensus of 5.0%, news welcomed by Fed officials. , who see wage pressures as an obstacle to tackling inflation.
Nick Timiraos, Fed watcher at The Wall Street Journal (WSJ), tweeted that “revisions to the average hourly earnings data paint a marginally less worrisome picture for the Fed on wages than the November report.”
The Dollar Index, which measures the value of the dollar against a basket of currencies, fell below the 105,000 point mark, boosted by Timiraos’s tweet, and stood at 104,963 points. However, it regained some ground, above 105,000, before reversing its trend and turning negative around 104,682, down 0.
it 46%.
Meanwhile, US Treasury Yields were down nine basis points to 3.625%, a headwind for USD/JPY, which is pulling back from daily highs hit at 134.77.
Atlanta Fed President Raphael Bostic has been making the news lately. He said the December labor market data does not change his outlook on the economy, adding that the Fed must stay the course as inflation remains too high. Bostic’s base case for the Federal Funds Rate (FFR) is to hit the 5.00-5.25% range, and stay at that level, well into 2024.
USD/JPY Price Analysis: Technical Perspective
In the short term, on the hourly chart of USD/JPY, the US dollar continues to weaken and extends its gains below the daily pivot point at 133.04. On its decline, USD/JPY broke above the 20 and 50 EMAs, although a downtrend line and the confluence of the 100 and 200 EMAs around 132.55/57 could halt the decline, away from the daily S1 pivot at 132.03. On the other hand, if USD/JPY recovers to 133.00, it could open the door for a resumption of the uptrend, exposing resistance levels such as the 134.00 signal, followed by the daily R1 pivot point at 134.45.
Source: Fx Street
I am Joshua Winder, a senior-level journalist and editor at World Stock Market. I specialize in covering news related to the stock market and economic trends. With more than 8 years of experience in this field, I have become an expert in financial reporting.


