
- USD/JPY fell below 142, shedding 0.47%, after US jobs data showed easing in the labor market and the Bank of Japan adjusted its YCC.
- US Nonfarm Payrolls disappointed estimates, but wages are rising, putting pressure on the Fed.
- US Treasury yields fall, a headwind for USD/JPY.
- Looking Ahead: Investors will be watching key economic indicators in the coming week, including the US July Inflation Report, Trade Balance and US Fed speeches.
The pair USD/JPY extended its losses to two straight days as United States (US) jobs data showed the labor market easing, while the Bank of Japan’s (BoJ) recent tightening to its control of the yield curve (YCC) boosted the Japanese Yen (JPY) against the US Dollar (USD). Thus, the USD/JPY pair is trading at 141.82 after reaching a daily maximum of 142.92, with a fall of 0.47%.
Despite rising average hourly earnings, disappointing US jobs data and recent BOJ yield curve control tightening push USD/JPY lower
Wall Street opened higher after the US Bureau of Labor Statistics (BLS) released nonfarm payroll numbers for July, which disappointed estimates of 200,000, slowing to 187,000 jobs. Although the data could encourage the Federal Reserve (Fed) not to raise rates in September, average hourly earnings rose 4.4% yoy, beating estimates of 4.2%, while the unemployment rate rose 3.6%, a point above 3.5%.
As a result, the US Treasury yield, primarily the 10-year Treasury yield, has erased a seven basis point gain compared to yesterday, and stands at 4.119%, a headwind for the USD/JPY pair, which is positively correlated with US bond yields, as traders take advantage of the carry trade.
However, the Bank of Japan’s decision to give flexibility to its YCC, within 0.50%-1%, keeps speculators guessing what the high point for the BoJ would be, as the bank has continued to carry out bond buying operations. not programmed in the market.
Meanwhile, the Dollar Index (DXY), which tracks the dollar against a basket of currencies, is down more than 0.50% and trades at 101.944, forming an afternoon three-candle pattern, suggesting further declines.
Looking ahead to next week, the US economic agenda will be marked by the July inflation report, the trade balance and the Fed speeches. On the Japanese front, the BO J summary of opinions and the Japan stream.
USD/JPY Price Analysis: Technical Perspective
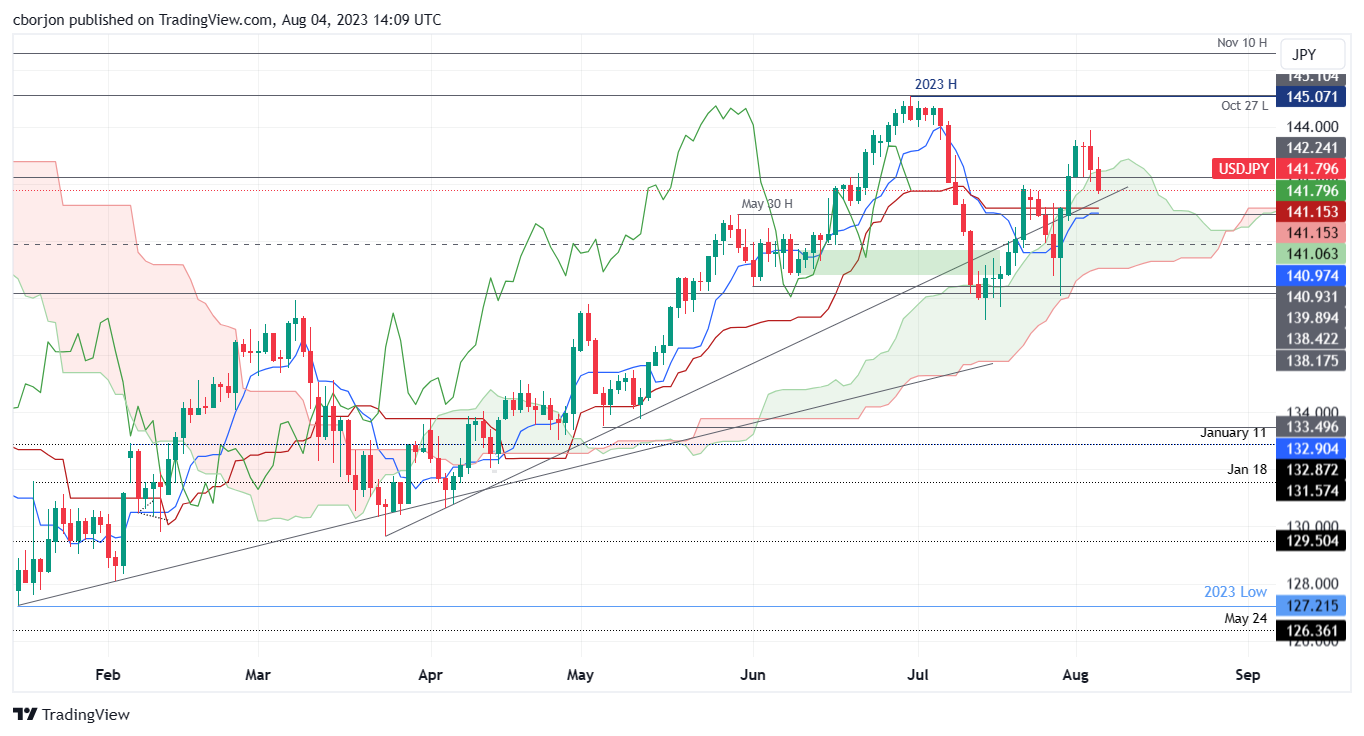
From a daily chart perspective, USD/JPY has dipped into the Ichimoku (Kumo) cloud, opening the door for further losses, which could be capped by Kijun and Tenkan-Sen levels, at 141.15 and 140.97, respectively. If it breaks below, the pair heads back towards the bottom of the Kumo at 139.05, before falling to the July 28 low at 138.05. Therefore, if the buyers fail to enter the market, the USD/JPY could wipe out almost 2.39% of its hard-earned gains. Conversely, USD/JPY buyers need to recapture the 142.00 figure to have a chance to regain control. The next target would be the 143.00 zone.
Source: Fx Street
I am Joshua Winder, a senior-level journalist and editor at World Stock Market. I specialize in covering news related to the stock market and economic trends. With more than 8 years of experience in this field, I have become an expert in financial reporting.


