
- USD/JPY took a hit and fell near 147.50.
- In the US, mixed economic data was reported. Treasury yields soar.
- Investors await the BOJ decision and Japanese inflation figures during the Asian session.
On Thursday, the USD/JPY faced bearish pressure, retreating near 147.50 and posting losses of 0.60%. On the one hand, hopes of a policy change from the Bank of Japan (BoJ) (or a signal) keep the Yen afloat, while the dollar remains firm, boosted by the rebound in US Treasury yields after the decision of the Federal Reserve (Fed) on Wednesday.
Despite the Yen’s strength against most of its rivals, the BOJ could disappoint markets on Friday and maintain its dovish stance. As noted, local wage and inflation trends are key factors in the decision-making process around monetary policy changes, so until those figures align with the bank’s forecasts, they will not consider abandoning its negative interest rate policy. However, any additional clues the BoJ gives in its statement will help investors shape their expectations for the upcoming meetings and will affect the Yen’s price dynamics.
On the other hand, the Federal Reserve (Fed) was more hawkish than expected at its September meeting with its rate forecasts, hinting at a further hike in 2023 and virtually delaying rate cuts in 2024. The rate mix Higher and longer interest rates boosted the dollar through higher Treasury yields, which are at multi-year highs. The 2-year rate is 5.16%, while the 5-year and 10-year yields shot up to 4.60% and 4.47%, respectively.
Elsewhere, mixed data was released in the US during the session, as jobless claims for the second week of September were lower than expected, while the Philadelphia Fed manufacturing survey fell to 13.5, disappointing expectations by a wide margin. It is worth mentioning that even though the Fed is hawkish in terms of interest rates, Chairman Powell noted that the upcoming decisions will depend solely on incoming data, so the US price dynamics. You will see volatility in the release of high-level economic figures. On Friday, markets await S&P Global PMI numbers for September.
USD/JPY Levels to watch
Despite the daily declines, USD/JPY suggests that the outlook for the pair on the daily chart remains bullish. The Relative Strength Index (RSI) is favorably positioned in positive territory above its midline, but reflects a bearish movement. Likewise, the moving average divergence (MACD) shows red bars, stating that the bears are gaining ground but are not there yet. Correspondingly, the pair is above the 20,100,200-day SMA, suggesting that the bulls are firmly in control of the overall picture.
Support Levels: 147.10 (20-day SMA), 146.00, 145.00
Resistance levels: 148.00, 149.00, 150.00.
USD/JPY Daily Chart
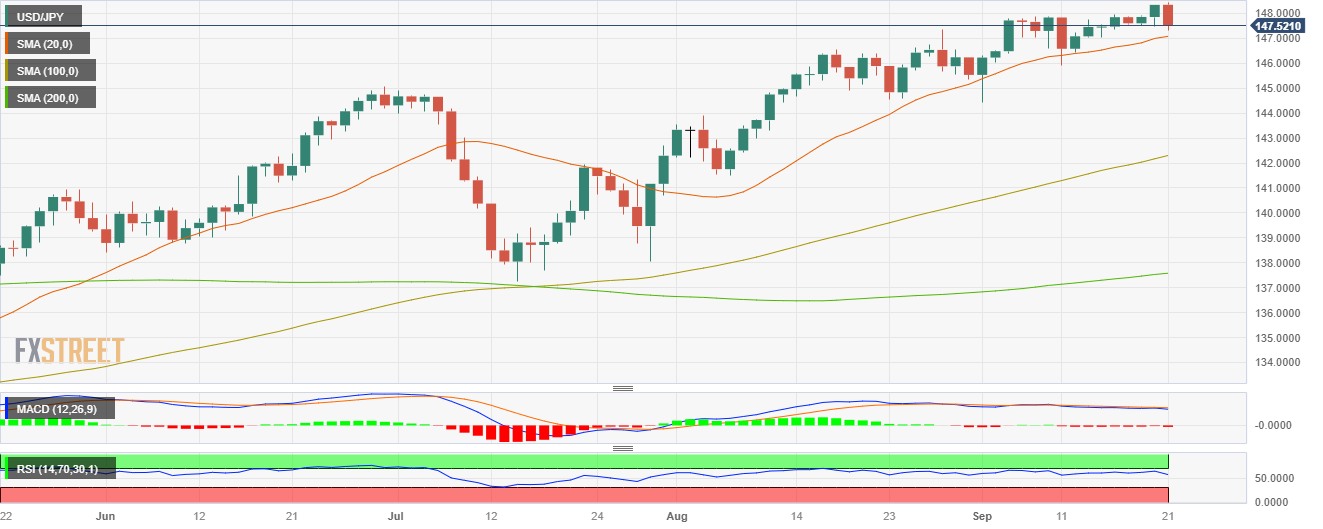
Source: Fx Street
I am Joshua Winder, a senior-level journalist and editor at World Stock Market. I specialize in covering news related to the stock market and economic trends. With more than 8 years of experience in this field, I have become an expert in financial reporting.


