
- The UM Sentiment Index fell to 77.9, indicating weakening US consumer confidence.
- The US Dollar appears to consolidate weekly gains following good inflation data.
- The Dollar will close a winning week of 1.60%.
The USD/JPY pair is currently trading at 152.95 with a modest loss of 0.17%. Despite the decline in consumer confidence in the US, indicated by the University of Michigan (UM) Consumer Sentiment Index, the Dollar will close a winning week, thanks to Wednesday's inflation data and on Thursday.
US consumer confidence weakened in early April, with the University of Michigan Consumer Sentiment Index falling to 77.9 from 79.4 in March. This reading was below market expectations of 79. The Business Index fell to 79.3 from 82.5 and the Consumer Expectations Index fell to 77 from 77.4. Survey details also revealed that the one-year inflation outlook rose to 3.1% from 2.9% in April, while the five-year inflation outlook rose to 3% from 2.8%.
That said, the US Bureau of Labor Statistics this week revealed an increase in inflation: the Consumer Price Index (CPI) rose to 3.5% year-over-year in March, up from 3.2% in February. The core CPI also increased to 3.8% annually, matching the February level. In this sense, good inflation figures fueled a sharp increase in hawkish bets on the Federal Reserve (Fed) and US Treasury yields, which benefited the dollar during the week. For now, markets appear to have given up on hopes of a rate cut in June and if the data validated those bets, the dollar could continue to rise. March retail sales in the United States will be published next Monday.
USD/JPY technical analysis
On the daily chart, the USD/JPY pair is trending steadily into positive territory on the Relative Strength Index (RSI). Even with the slight decline seen below 70, the dominant trend is bullish and buyers appear to be correcting overbought conditions. Simultaneously, a reading of green bars on the moving average convergence divergence (MACD) histogram consolidates the buying impulse thesis.
USD/JPY daily chart
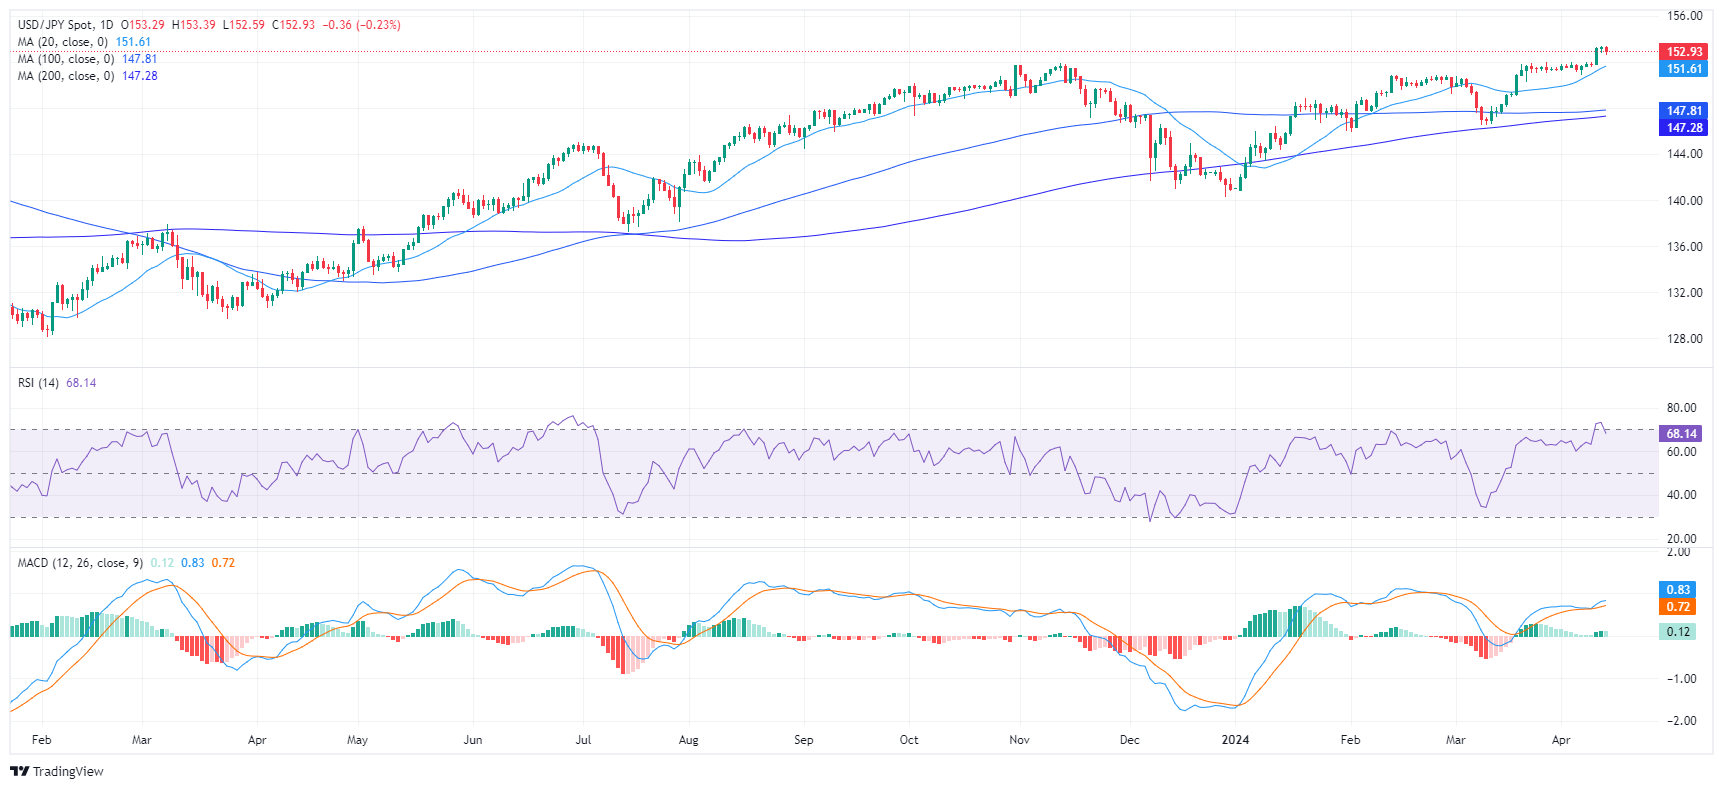
Looking at the bigger picture, USD/JPY reveals a bullish stance. The pair's position above the 20-day, 100-day, and 200-day simple moving averages (SMA) shows a positive short-term and long-term trend.
Source: Fx Street
I am Joshua Winder, a senior-level journalist and editor at World Stock Market. I specialize in covering news related to the stock market and economic trends. With more than 8 years of experience in this field, I have become an expert in financial reporting.


