
- US inflation cools, causing the dollar to fall across the board.
- US jobless claims were lower than estimates, reflecting the strength of the labor market.
- Fed’s Harker: It’s time for the Fed to raise rates a little less.
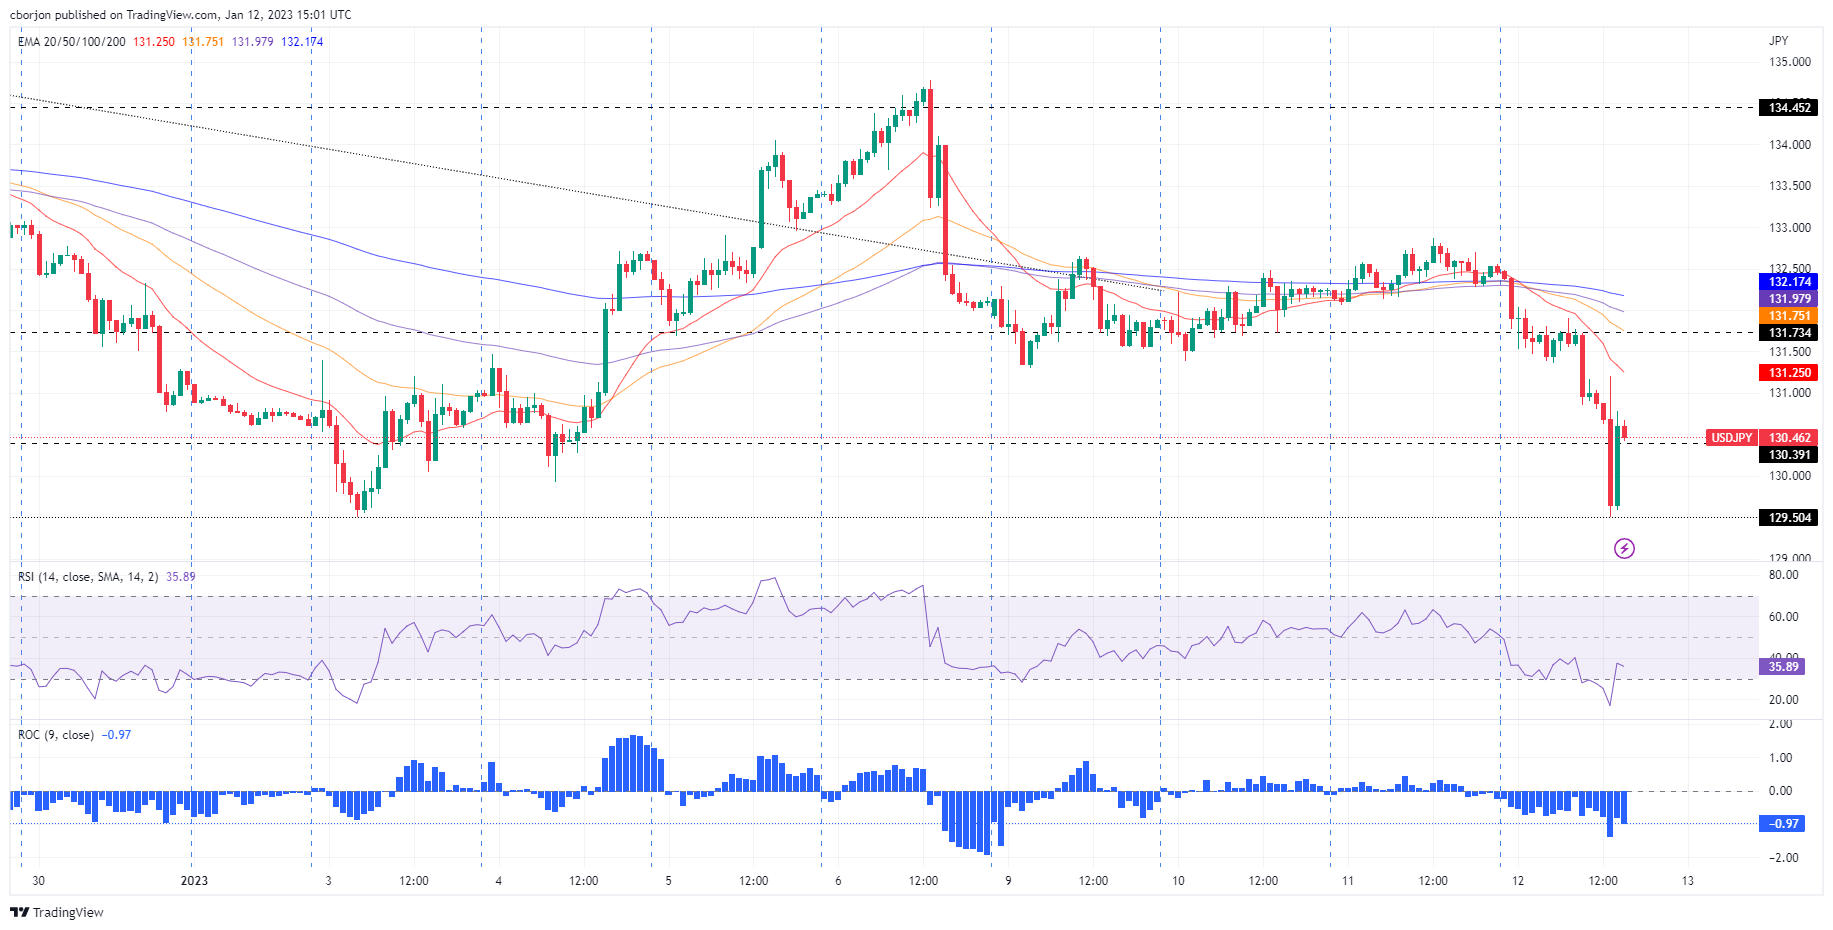
The USD/JPY breaks with two days of gains and falls more than 200 pips on Thursday, following the release of softer US inflation data, while jobless claims came in below estimates. At the time of writing, the pair recovers from the daily low of 129.50 and trades at 130.44losing -1.46% on the day.
The US Department of Labor revealed that headline inflation, also known as Consumer Price Index (CPI) for December, slowed as expected to 6.5% year-on-year from 7.1% in November. Meanwhile, month-on-month data showed inflation at -0.1%, below the 0% estimate. Meanwhile, excluding volatile food and energy data, the so-called core CPI stood at 5.7% year-on-yearbelow the 6% expected.
Following the data release, USD/JPY fell sharply as the data justified the reduction of the interest rate hikes of the US Federal Reserve (Fed) to 25 basis points, in their struggle to curb high inflation. At the same time, the Bureau of Labor Statistics revealed that initial claims for jobless benefits last week stood at 205,000, below the 215,000 claims that analysts expected, demonstrating the resilience of the labor market.
Apart from this, the president of the Philadelphia Fed, Patrick Harker, has said that a 25 basis point rise would be appropriate looking ahead after the release of the US CPI report. Harker has commented that the time for large-scale rate hikes has passed and expect a few more hikes this year.
USD/JPY Price Analysis: Technical Perspective
The USD/JPY 1 hour chart shows the pair’s reaction to the US data. After the release, the pair tested the low of 129.50, although it bounced higher, but the readings on the Relative Strength Index (RSI) and the Rate of Change (RoC) confirm that sellers are in control. Therefore, USD/JPY could resume its downtrend.
Key USD/JPY support levels are at 130.00followed by the minimum of January 12 in 129.49. On the other hand, the first resistance level of USD/JPY is located at 131.00followed by the 20 EMA at 131.26.
Source: Fx Street
I am Joshua Winder, a senior-level journalist and editor at World Stock Market. I specialize in covering news related to the stock market and economic trends. With more than 8 years of experience in this field, I have become an expert in financial reporting.


