- USD/JPY rises after a US inflation report indicates a reacceleration, challenging levels that could prompt intervention.
- Rising inflation pushes up Treasury yields and boosts the US dollar.
- The market anticipates the Fed's future actions with great interest in the next monetary policy minutes.
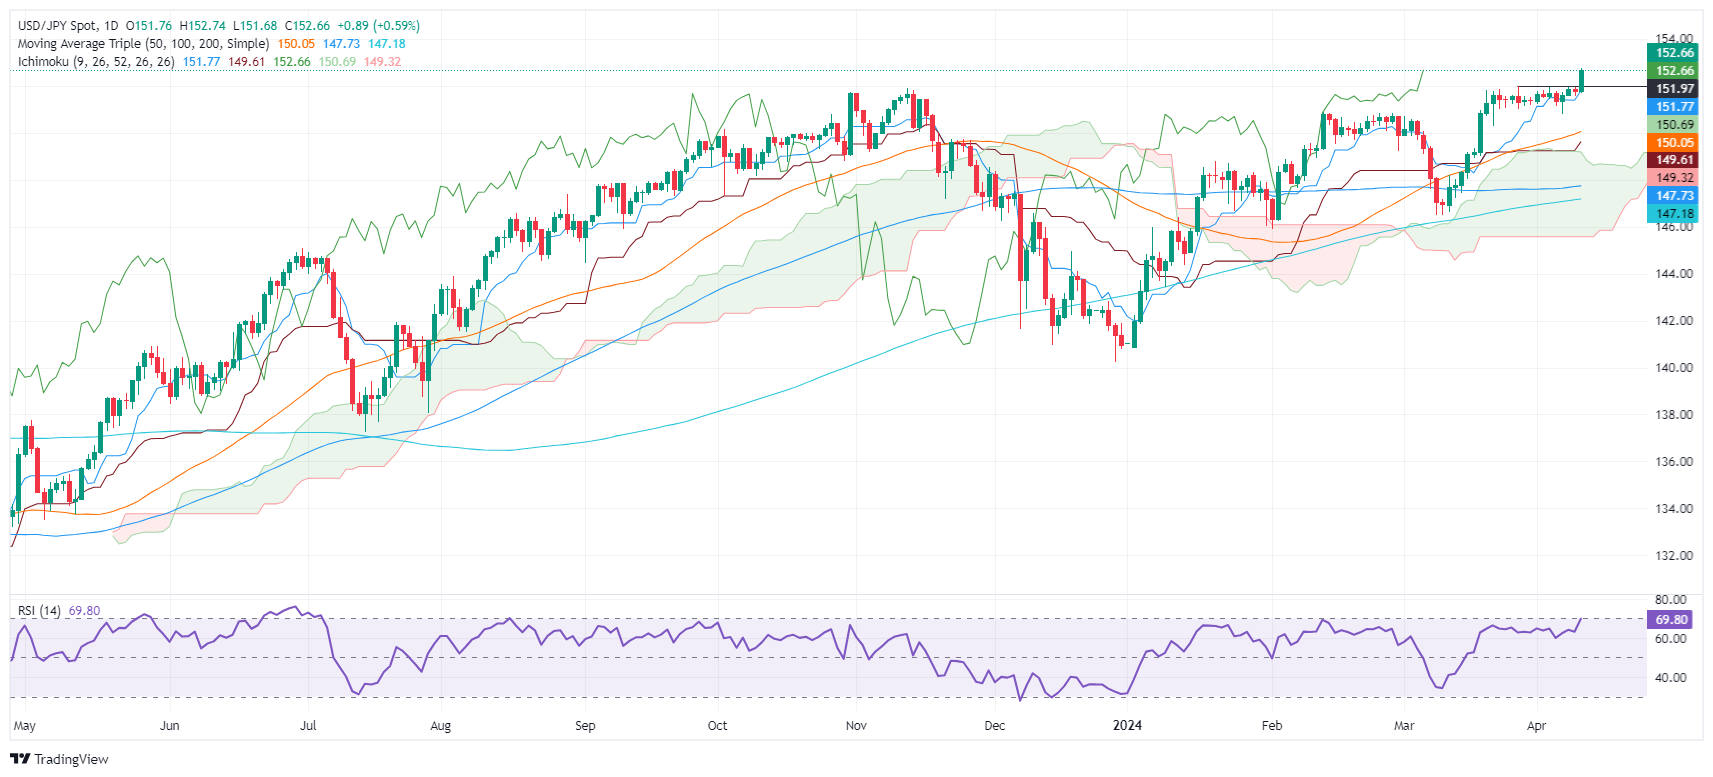
USD/JPY hit near 34-year highs after a higher-than-expected US inflation report sent US Treasury yields soaring. Consequently, the pair surpassed the 152.00 barrier, a level that could trigger an intervention, something that has not happened so far. At the time of writing, the pair is trading at 152.70, with a gain of 0.90%.
USD/JPY advances to 152.70 as US CPI data sparks sharp rise in yields, fueling speculation on Fed rate path
US economic data released by the Bureau of Labor Statistics (BLS) showed that inflation is accelerating. The Consumer Price Index (CPI) rose 0.4% monthly and 3.5% annually, exceeding estimates. The core CPI, which excludes volatile items such as food and energy, was above forecasts, but unchanged from February data, at 0.4% monthly and 3.8% annually.
This sparked a reaction in financial markets, as US Treasury yields soared, with the short end of the curve, i.e. the 2-year T-note, rising 20 basis points. Consequently, the Dollar refreshed the yearly highs of 105.10, although it retreated a little, as shown by the US Dollar Index (DXY). The DXY rose 0.81% to 104.95.
Following the inflation report, Chicago Stock Exchange Fed Funds (CBOT) futures estimate only two rate cuts through December 2024, and speculators expect interest rates to end up around 4.97%.
The USD/JPY rose sharply and hit multi-year highs at 152.73, a level last seen in June 1990, ignoring threats of intervention by Japanese authorities, including the minister of Finance, Shunichi Suzuki, who said he was watching the market with a high sense of urgency and would not rule out any measures to address excessive movements.
Ahead on the calendar, market agents are attentive to the publication of the latest monetary policy minutes from the Federal Reserve.
USD/JPY Price Analysis: Technical Outlook
Technically, the USD/JPY pair is trading at 1990s levels. With the major extending its gains beyond 152.00, which exposes the June 1990 highest high in 155.78, followed by the 1990 high at 160.32. On the other hand, the first support would be the psychological level of 152.00, followed by the Tenkan-Sen at 151.77 and the April 5 low at 150.81.

USD/JPY
| Overview | |
|---|---|
| Latest price today | 152.65 |
| Today Daily Change | 0.88 |
| Today's daily variation | 0.58 |
| Today daily opening | 151.77 |
| Trends | |
|---|---|
| daily SMA20 | 150.9 |
| 50 daily SMA | 149.94 |
| SMA100 daily | 147.7 |
| SMA200 Journal | 147.14 |
| Levels | |
|---|---|
| Previous daily high | 151.94 |
| Previous daily low | 151.57 |
| Previous weekly high | 151.95 |
| Previous weekly low | 150.81 |
| Previous Monthly High | 151.97 |
| Previous monthly low | 146.48 |
| Daily Fibonacci 38.2 | 151.71 |
| Fibonacci 61.8% daily | 151.8 |
| Daily Pivot Point S1 | 151.58 |
| Daily Pivot Point S2 | 151.39 |
| Daily Pivot Point S3 | 151.22 |
| Daily Pivot Point R1 | 151.95 |
| Daily Pivot Point R2 | 152.12 |
| Daily Pivot Point R3 | 152.31 |
Source: Fx Street
I am Joshua Winder, a senior-level journalist and editor at World Stock Market. I specialize in covering news related to the stock market and economic trends. With more than 8 years of experience in this field, I have become an expert in financial reporting.


