
- The USD/JPY pair broke above the 140.00 area during the American session.
- The US dollar overcame daily losses amid rising US bond yields and cautious markets.
- Investors await first quarter gross domestic product data from Japan.
The pair USD/JPY It rose for the second day in a row on Wednesday and is currently trading around 140.00. On the other hand, according to the US Dollar Index (DXY), the Greenback weakened against most of its rivals but pared daily losses finding support at 103.66 and recovering above 104.00, thanks to a significant rise in US bond yields. Another surprising rate hike, this time by the Bank of Canada (BOC), slightly added to the aggressive bets on the Fed.
Surprising BOC decision fueled hawkish bets on Fed
Market expectations for the next Federal Reserve (Fed) meeting on June 13-14 continue to favor no hike, even though the BoC’s surprise hike on Wednesday boosted prospects for another Fed hike. According to CME’s FedWatch tool, investors are most likely (64.7%) to bet that the Fed will not raise interest rates, with expectations to keep the target rate at 5.25%, but the odds of a 25-point hike basic rose to 30%.
Against this background, US bond yields are rising across the curve. The 10-year bond yield rose to 3.78%, while the 2-year yield was at 4.59% and the 5-year yield was at 3.94%, all higher on the day, boosting the American dollar.
On the other hand, the fall of the Yen could be limited by speculation that the Japanese authorities intervene in the markets to support the national currency. For Wednesday’s session, the markets’ caution on the weak Chinese economic data reported during the Asian session weighed on the Yen as it fueled risk appetite in the markets.
technical levels
According to the daily chart, USD/JPY maintains a neutral to bullish outlook for the short term. The Relative Strength Index (RSI) is holding firm above its midline, while the MACD has dipped slightly into the negative zone, but the pair is trading above the SMA of 20, 100 and 200 days, which suggests that the overall technical picture is positive for the pair.
If USD/JPY manages to rally, the next resistance to watch is the 140.00 level, followed by the 140.50 zone and the psychological level at 141.00. On the other hand, the 139.50 level is key for USD/JPY to maintain its bullish bias. If broken down, the pair could see a steeper decline towards the psychological level of 139.00 and the weekly low and then to the 20-day SMA at 138.60.
USD/JPY daily chart
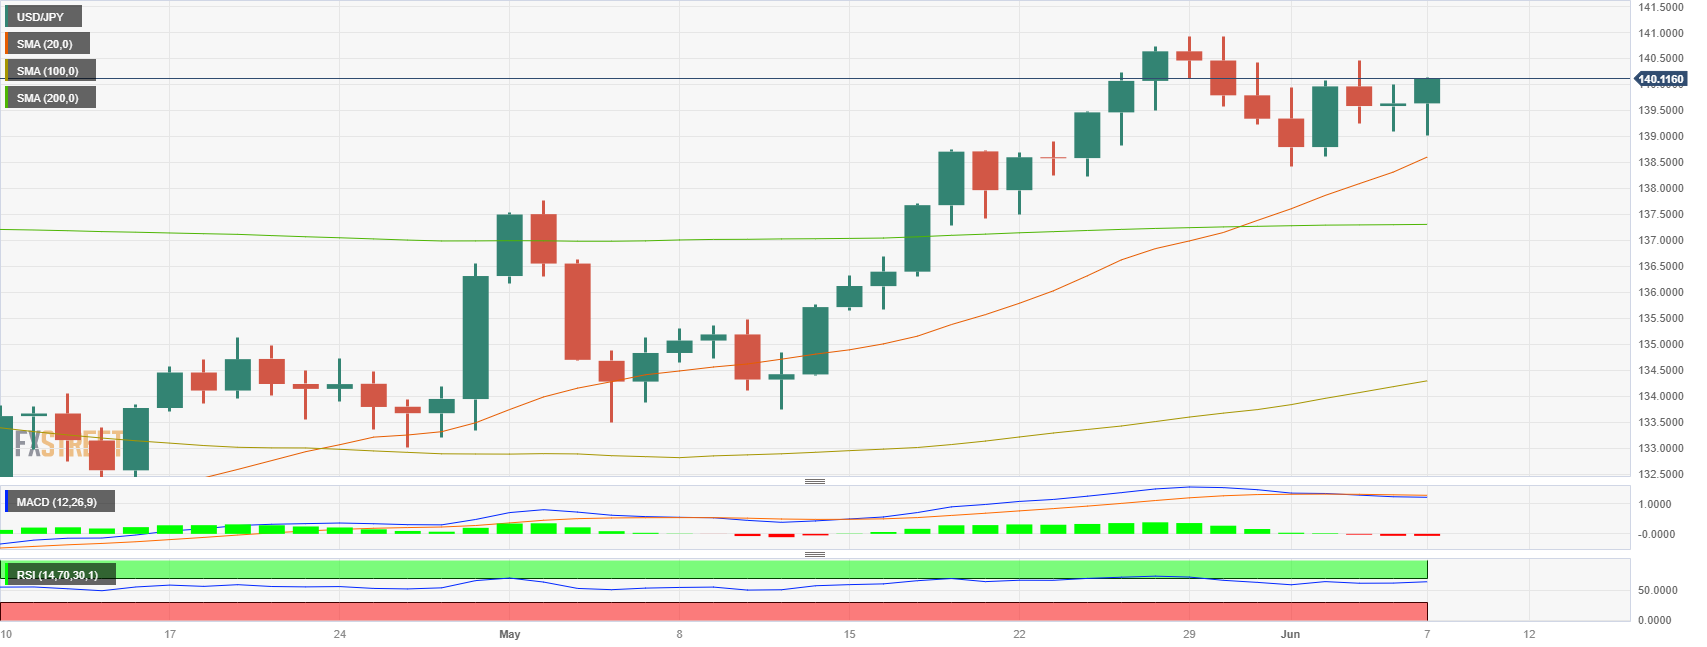
Source: Fx Street
I am Joshua Winder, a senior-level journalist and editor at World Stock Market. I specialize in covering news related to the stock market and economic trends. With more than 8 years of experience in this field, I have become an expert in financial reporting.


")
