
- USD/JPY bounces away from weekly lows around 132.50, underpinned by rising US bond yields.
- The pair is facing solid resistance around 134.50-65; once surpassed, a jump to 135.00 is anticipated.
- In the short term, USD/JPY is expected to pull back towards the 133.50-60 area before resuming the rise.
The USD/JPY jumps from near the weekly lows to a crowded resistance zone, with the 20-day EMA at 134.62, next to a descending resistance trend line, drawn from the July highs (also year highs), passing close from the 20-DMA. At the time of writing, the USD/JPY is trading at 134.27.
USD/JPY Price Analysis: Technical Outlook
From a daily chart point of view, the main bias is neutral to the upside, but a wall of resistance is emerging ahead of the 135.00 figure. However, the RSI crossing above its 7-day RSI SMA, which is also about to cross the 50 midline, illustrates that buying pressure is building in the pair. This, coupled with rising US Treasury yields, may prop up USD/JPY higher.
Therefore, the first resistance for the USD/JPY would be the 20-day EMA. Once broken, the next resistance would be the 135.00 figure, followed by a test of the August high at 135.58.
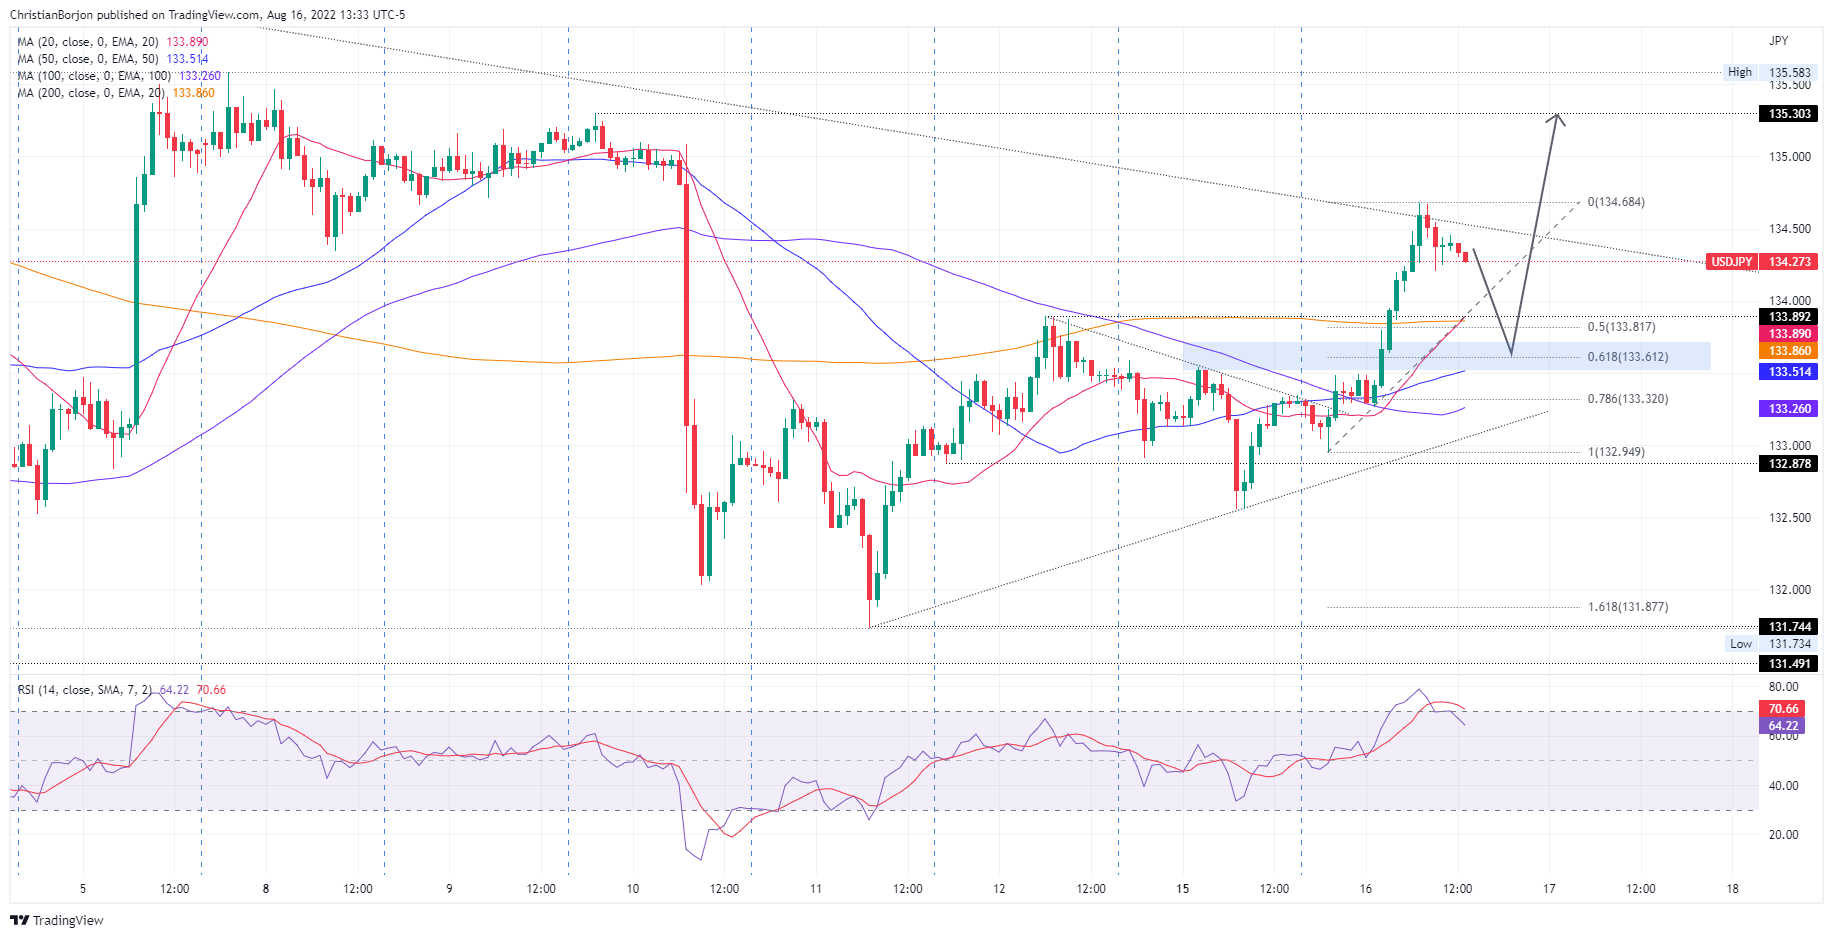
On the one hour timeframe, USD/JPY has a bullish bias, but in the last few hours, the pair pulled back as the RSI entered overbought conditions. Therefore, the major could print a leg lower before resuming the uptrend of the upper time frame towards 135.00 and beyond.
Therefore, the first support for USD/JPY would be the 50% Fibonacci retracement at 133.81. If it breaks below, the confluence of the 50 day EMA and the 61.8% retracement of the Fibonacci level at 133.50-60 will be seen. After that, USD/JPY could resume the rise, towards the daily high of 9th August at 135.30.
Technical levels
Source: Fx Street
With 6 years of experience, I bring to the table captivating and informative writing in the world news category. My expertise covers a range of industries, including tourism, technology, forex and stocks. From brief social media posts to in-depth articles, I am dedicated to creating compelling content for various platforms.


")

")
