
- USD/JPY teeters in a 70 pip range but remains in losing territory, down 0.27%.
- Risk appetite took a toll on demand for the greenback, which lost 0.80%, as the US dollar index shows.
- USD/JPY Price Analysis: The rising wedge on the daily chart could open the door towards the July lows around 134.70.
The USD/JPY falls for the second day in a row, hitting a daily low near 137.89, amid bullish sentiment, as evidenced by rising global equities; while the greenback retreats from 108,000, as shown by the US dollar index, losing almost 0.80%, at 107,192.
USD/JPY is trading at 138.09, inside a tight 70 pip range, in which the pair hit a daily high at 138.57 before dipping below 138.00, but once the dust settled, buyers regained interest. 138.00 level on a day of little liquidity as Japanese markets were closed on Monday and no economic data was released.
USD/JPY Price Analysis: Technical Outlook
USD/JPY daily chart
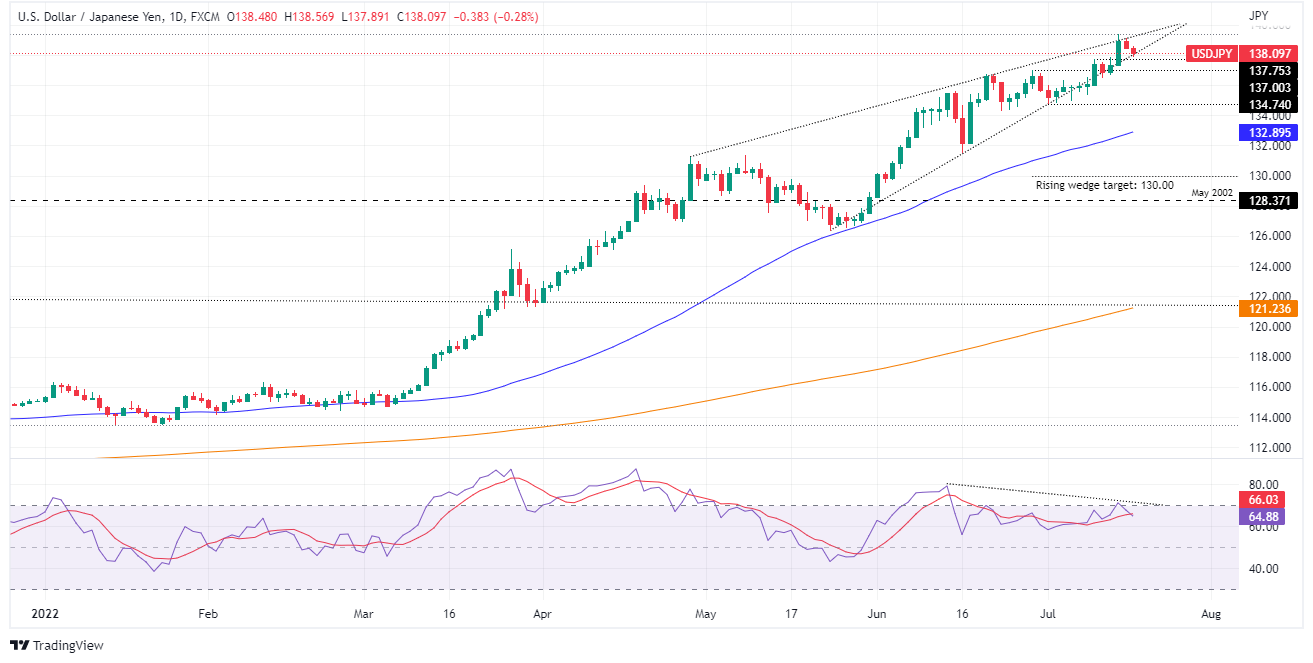
The USD/JPY daily chart is trending up, despite showing signs of losing strength after reaching a 24-year high around 139.38. Traders should note that a rising wedge is still in play and, based on price action, remains confined within the upper and lower trend lines of the aforementioned chart pattern, meaning USD/JPY is about to break. break in any direction.
If USD/JPY ends higher, the first resistance for USD/JPY would be 139.00. If the latter is broken, the high of the last few years at 139.38 will be exposed. Once broken, the 140.00 level will be open for a challenge as USD/JPY heads towards the August 1998 high of 147.67.
On the other hand, the first support for USD/JPY would be the July 11 high at 137.75. A break below will expose the 29th June daily high at 137.00, followed by a test of the 1st July low at 134.74.
Key USD/JPY Technical Levels
Source: Fx Street
With 6 years of experience, I bring to the table captivating and informative writing in the world news category. My expertise covers a range of industries, including tourism, technology, forex and stocks. From brief social media posts to in-depth articles, I am dedicated to creating compelling content for various platforms.


”")
