
- USD/JPY is almost sideways on the day, down 0.01%.
- Positive market mood and rising US Treasury yields cap USD/JPY decline.
- USD/JPY Price Forecast: Bias is neutral to the upside, but a break below 126.90 could open the door for further losses.
The USD/JPY down and records minimal losses of 0.01% in the American session, courtesy of a positive mood and a weaker USD. At the time of writing, the USD/JPY is trading at 127.84.
Sentiment remains bullish as US equities gain 1.27%-1.90%. The dollar index, a gauge of the USD’s value against a basket of pairs, is down 0.87% and clinging to 102,000, a headwind for USD/JPY. However, rising US Treasury yields cap the slide as the 10-year Treasury yield is up almost seven basis points to 2.853%.
In the currency space, risk appetite is keeping safe-haven pairs lower and risk-sensitive currencies such as the AUD, NZD and GBP higher.
On Monday in the Asian session, USD/JPY opened near the daily pivot point at 127.90. However, the pair fell below the S1 pivot at 127.31, towards daily lows around 127.15. However, the pair rebounded from the lows during the European session and printed the daily high at 127.85.
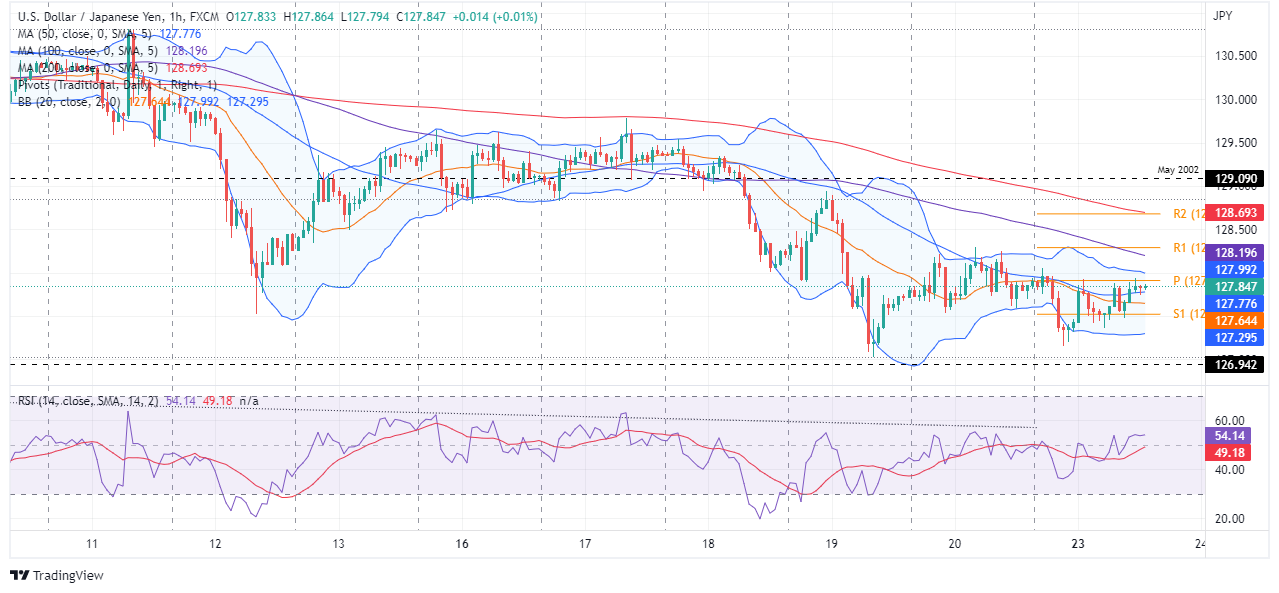
USD/JPY Price Forecast: Technical Outlook
USD/JPY remains neutrally biased to the upside from a daily chart point of view, although it did come close to the April 26 lows around 126.94, and was unable to break support. However, the pair could change its bias to neutral if USD/JPY bulls fail to break out of the 20-DMA at 129.23, exposing the pair to selling pressure.
The 1 hour chart of USD/JPY shows that the pair is trapped between the 50 and 100 hour Simple Moving Averages (SMAs) at 127.98 and 128.19, respectively, but it is bullish. Why? The 20-hour SMA is below the exchange rate, while the Relative Strength Index (RSI) has moved higher above the 50 mid-line. Therefore, the USD/JPY bias is bullish.
The first resistance for USD/JPY would be the daily pivot at 127.90. If broken, the pair would rally above 128.00 and head towards the 100-hour SMA at 128.19. Once broken, the next resistance would be the R1 pivot point at 128.28, followed by the confluence of the 200 hourly SMA and the R2 pivot point at 128.67.
Technical levels
Source: Fx Street
With 6 years of experience, I bring to the table captivating and informative writing in the world news category. My expertise covers a range of industries, including tourism, technology, forex and stocks. From brief social media posts to in-depth articles, I am dedicated to creating compelling content for various platforms.


